
History
A 51-year-old male patient, suffering from pulmonary adenocarcinoma with lymphangitic carcinomatosis, bone and neuro metastases, had undergone chemotherapy as well as immunotherapy. A contrast chest and abdomen CT examination was requested for a follow-up evaluation of treatment response.
Diagnosis
Virtual monoenergetic CT images, displayed at 60 keV, revealed a partial regression of several nodules and areas of consolidation, also of the lymphangitic carcinomatosis. The hilar and mediastinal adenopathy had decreased in size. The evolution of the bone metastases in the sternum and in the 7th left-sided rib was also seen. The azygos and hemiazygos veins were dilated. A slight blunting of the right costophrenic angle was noticed, indicating a small, newly formed pleural effusion. A thickening of the bilateral adrenal glands and of two small hypodense lesions in the liver were visualized, suspicious of metastases. For the evaluation of the pulmonary arteries (PA), image display was switched from 60 keV to 40 keV. This increased the attenuation in the main PA (MPA) from 248 HU to 481 HU which was sufficient for the visualization of endo- and peri-vascular abnormalities. There were no signs of incidental pulmonary embolism (PE) seen, and the lung perfused blood volume (Lung PBV*) images showed no perfusion defect. Based upon the CT findings, a satisfactory response to the initiated treatment was anticipated, leading to the upholding of the proposed immuno-chemotherapy.

Courtesy of Department of Thoracic Imaging, University Centre of Lille, France
Fig. 1: Axial images displayed at 70 keV (Fig. 1a), 60 keV (Fig. 1b) and 40 keV (Fig. 1c) show a difference in the attenuation of the MPA (193 HU, 248 HU and 481 HU). The contrast material in the SVC is homogeneous and causes no streak artifacts. A central venous catheter (arrow) is also seen.

Courtesy of Department of Thoracic Imaging, University Centre of Lille, France
Fig. 2: A coronal image displayed at 70 keV (Fig. 2a) shows an insufficient and slightly heterogeneous attenuation in the posterior basal segmental PA (arrow). The attenuation is increased in the image displayed at 60 keV (Fig. 2b) and is clearly restored in the image displayed at 40 keV (Fig. 2c), confirming an absence of PE. A Lung PBV image (Fig. 2d) shows a homogeneous iodine distribution in the lungs without perfusion defect. A slight blunting of the right costophrenic angle is seen, indicating a small pleural effusion. The azygos and hemiazygos veins are dilated.
Courtesy of Department of Thoracic Imaging, University Centre of Lille, France
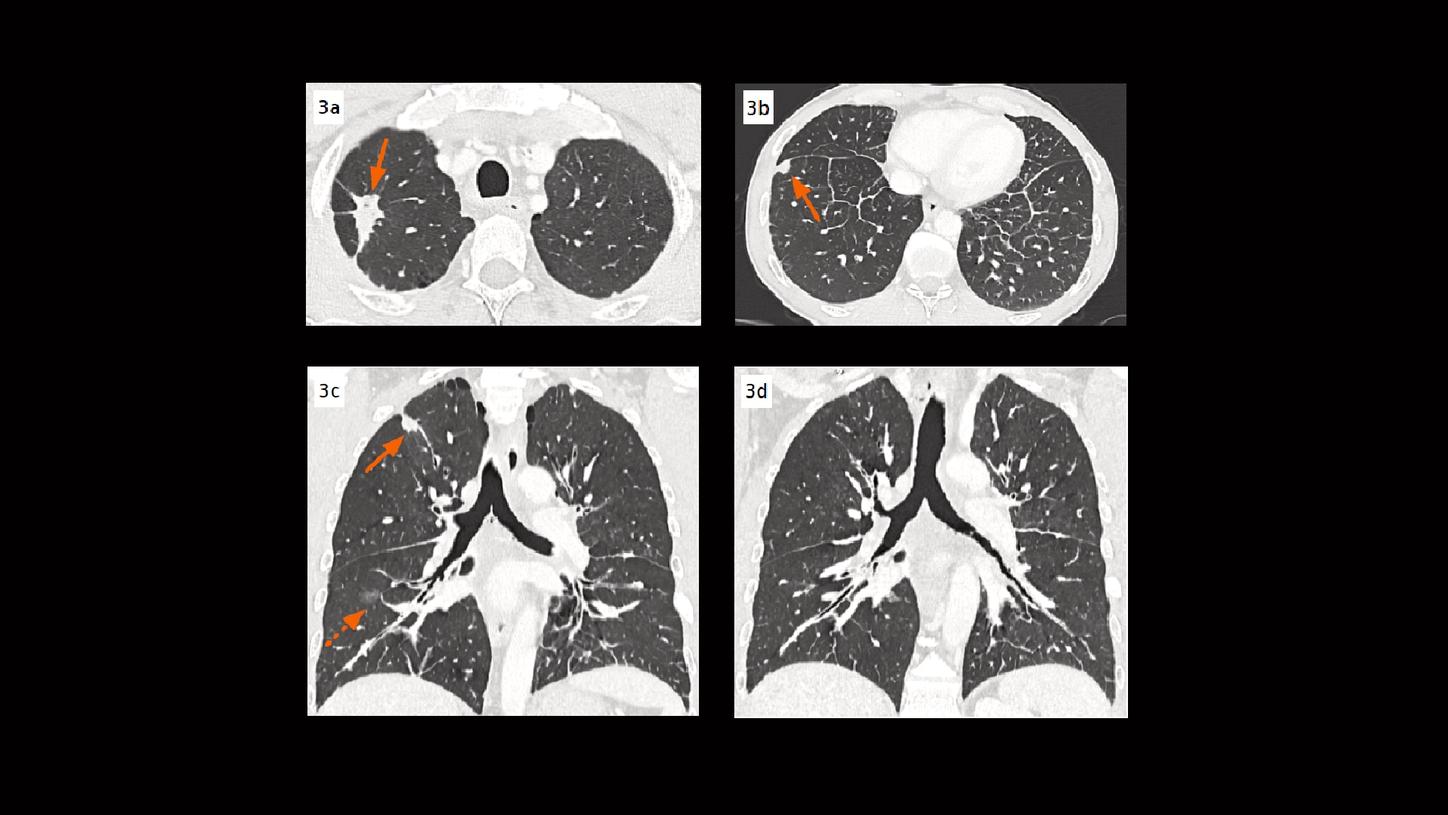
Fig. 3: Axial images (Figs. 3a & 3b) and coronal MPR images (Figs. 3c & 3d) show lung nodules (arrows) in the right upper and lower lobes. A small area of consolidation (dotted arrow) is also seen in the right lower lobe. Both central and peripheral lymphangitic carcinomatosis are visualized.

Courtesy of Department of Thoracic Imaging, University Centre of Lille, France
Fig. 4: A coronal and an axial view show a bone metastasis in the sternum (Figs, 4a & 4b, arrows). A rib cage unfolding image (Fig. 4c) shows a metastatic lesion in the 7th left-sided rib (dotted arrow).

Courtesy of Department of Thoracic Imaging, University Centre of Lille, France
Fig. 5: Axial images show a thickening of bilateral adrenal glands (Fig. 5a, arrows) and two small hypodense lesions in the liver (Figs. 5b & 5c, dotted arrows), suspicious of metastases.
Comments
Non-small cell lung cancer (NSCLC) is the most common type, representing 84% of all lung cancers. Among its various histotypes, adenocarcinomas are most predominant, accounting for approximately 40%. [1] Lung cancer staging and follow-up evaluation on treatment response are commonly performed with a contrast-enhanced CT. An optimal scan protocol has been broadly investigated and recent literature has suggested that imaging during the venous phase can aid in nodal, pleural, and parenchymal assessment. [1, 2] At this phase, tumoral structures, e.g., necrotic areas, as well as lesions at the level of the pleura and pericardium, are better enhanced and visualized. The contrast material in the superior vena cava (SVC) and brachiocephalic veins is diluted due to recirculation, and no longer causes streak artifacts. This improves visualization and characterization of the lymph nodes. However, a potential drawback of the venous phase CT is the potential reduction in the identification of incidental PE, which is not an uncommon finding in this patient demographic – these patients are at increased risk of thromboembolic disease, and detection would allow for appropriate treatment. [2] With the introduction of Dual Energy CT imaging, studies have been explored and shown that virtual monoenergetic images displayed at lower keV levels can increase iodine attenuation and improve diagnostic image quality for detecting PE as an incidental finding in portal-venous phase CT scans. [3]
This case is performed on NAEOTOM Alpha, a newly developed Dual Source CT scanner with photon-counting detectors (QuantaMax™), providing energy-resolved CT data with inherent spectral information and improved tissue contrasts, without electronic noise. [4] The spectral data is available in all routine scans allowing for an easy switch of image display at different monoenergetic keV settings. This is especially helpful in cases of suboptimal contrast attenuation – virtual monoenergetic images can be displayed at lower keV settings (low-energy) to improve contrast enhancement. To illustrate, images that were traditionally displayed at 70 keV (equivalent to a standard 120 kV acquisition), are now routinely displayed at 60 keV, as the standard energy level for images acquired during the venous phase, to obtain an acceptable compromise for contrast-enhanced soft tissue structures as well as vasculatures. When necessary, images can be displayed at an even lower energy level, e.g., 40 keV, to further increase the iodine enhancement in the PAs for a more confident PE evaluation. The spectral data can also be used to create iodine maps (Lung PBV), resulting in a simultaneous assessment of the pulmonary vasculature as well as the analysis of the parenchymal iodine distribution. The combination of the absence of electronic noise and the missing down-weighting of the lower energy X-ray photons increases the iodine contrast-to-noise ratio (CNR) to an optimal extent, improving the image quality at low-energy display for routine diagnosis, as well as prompting a potential reduction of the radiation dose and the amount of contrast agent needed.
As shown in this case, the availability of spectral CT data provided by photon-counting CT plays an important role in clinical routine. The easy switching between energy levels, for image display, enables the physicians to make a comprehensive evaluation of treatment response and to rule out incidental PE, using just a single acquisition during the venous phase.
Examination Protocol