History
A 65-year-old female patient, suffering from atypical chest pain for the past year, came to the hospital for a check-up. Her medical history included hypercholesterolemia and borderline type 2 diabetes on dietary control. Coronary CT angiography (cCTA) was performed, followed by dynamic CT myocardial perfusion imaging (MPI) in rest and under stress using adenosine-mediated vasodilation.
Diagnosis
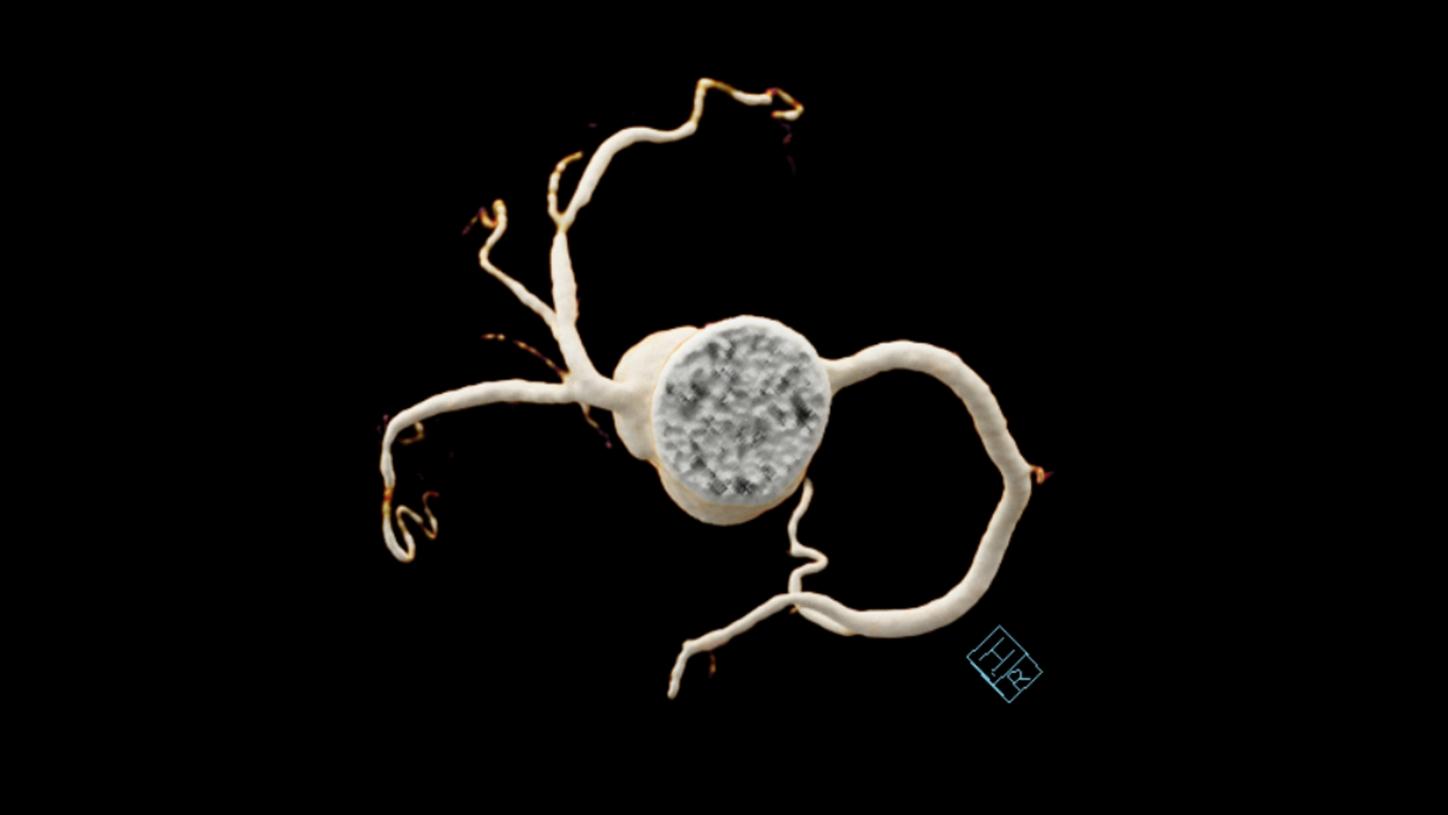
Coronary CTA images showed a right coronary artery (RCA) dominant system, and a moderate stenosis in the proximal left anterior descending artery (LAD). A suspected significant stenosis involving mid LAD, distal LAD and the second diagonal branch (D2) at the bifurcation of the LAD/D2 (Medina classification 1,1,1) was visualized. No signs of stenosis were seen in the circumflex (Cx) and RCA. MPI did not show focal or territorial ischemia in the myocardium with a normal myocardial blood flow (MBF) of 127 mL/100mL/min in rest, and 248 mL/100mL/min under stress.
Subsequently, the patient underwent invasive coronary angiography (ICA), which confirmed the CT findings, and measured a normal LAD fractional flow reserve (FFR) of 0.85. No interventional therapy was performed.Fig. 1: An axial MIP image (Fig. 1a) and a cinematic VRT image (Fig. 1b) show a moderate stenosis in the proximal LAD (arrows) and a significant stenosis at the LAD/D2 bifurcation (dotted arrows).
Fig. 2: MBF images in both short (Figs. 2a and 2c) and long (Figs. 2b and 2d) axis reveal no evidence of myocardial perfusion defects in rest (Figs. 2c and 2d) and under stress (Figs. 2a and 2b). The absolute global MBF value was measured 127 mL/100mL/min in rest, and 248 mL/100mL/min under stress.
Fig. 3: Angiographic images confirm the moderate stenosis at proximal LAD (Fig. 3a, arrow), and significant stenosis at the LAD/D2 bifurcation (Fig. 3b, arrow).
Comments
Coronary bifurcation lesions account for up to 20% of all PCI, and the treatment with stenting remains challenging due to numerous possible techniques and high risk of complications.[1] In order to make an appropriate treatment decision, i.e. stenting or no stenting, it is important not only to acquire diagnostic information about a coronary bifurcation stenosis, but also to assess its hemodynamic relevance. This can be evaluated comprehensively and noninvasively with a single modality by combining coronary CTA with dynamic CT MPI. In this case, a coronary artery disease involving a coronary bifurcation is visualized. However, both MPI in rest and under stress show no focal or territorial perfusion defects. The global MBF value under stress is almost twice of the one in rest, which confirms expected increase in flow denoting flow reserve. This agrees with the measured FFR value of 0.85 in PCI. Therefore, no interventional therapy was performed to this patient. It is also noteworthy that a systolic ECG-triggered Sequential Shuttle mode is used with an absolute delay of 250 ms, which is insensitive to extra-systolic events and improves myocardial perfusion evaluation since the myocardium is thicker in systole. It also is very robust for high and varying heart rates – this patient’s heart rate varied from 63 to 120 bpm over both examinations. CARE Dose4D (Real time anatomic exposure control) and 70 kV are applied to minimize radiation exposure.


