
History
An 83-year-old male patient, with a previous episode of massive acute thromboembolic disease within the context of COVID-19, was diagnosed with pre-capillary pulmonary hypertension (PH). He was referred for a contrast enhanced chest CT to evaluate the etiology of the PH. The cardiologist in charge suspected that the chronic thromboembolic pulmonary hypertension (CTEPH) was pre-existent to the hospitalization for COVID-19 and was searching for potential fibrotic sequelae of COVID-19 in the lungs.
Diagnosis
CT angiography (CTA) images showed dilation of the central pulmonary arteries (PA), tapering and pruning of the peripheral PA, significant enlargement of the right atrium as well as a moderate enlargement of the right ventricle, intravascular webs and filling defects, a dilated bronchial artery, along with a pattern of mosaic perfusion in both lungs. In the spectral image data assessment of the lung perfused blood volume (LungPBV*), multiple peripheral wedge-shaped perfusion defects were evident bilaterally. These findings were consistent with CTEPH. There were no features of any COVID-19 sequelae. The patient was transferred to the national reference center for therapeutic decision. Owing to the presence of proximal obstruction of the pulmonary arterial circulation on the chest CTA, the patient was considered as eligible for pulmonary thromboendarterectomy (PTE), after medical treatment to decrease the level of pulmonary vascular resistance prior to surgery.

Courtesy of Department of Thoracic Imaging, University Centre of Lille, France
Fig. 1: An axial image shows proximal filling defects in the PA of the right middle lobe as well as in the anterior segmental PA of the left lower lobe (Fig. 1a, arrows). A coronal MPR image shows a “web” sign in the segmental PA of the right upper lobe (Fig. 1b, arrow). A significant enlargement of the right atrium and moderate enlargement of the right ventricle are also seen (Fig. 1c).
Courtesy of Department of Thoracic Imaging, University Centre of Lille, France
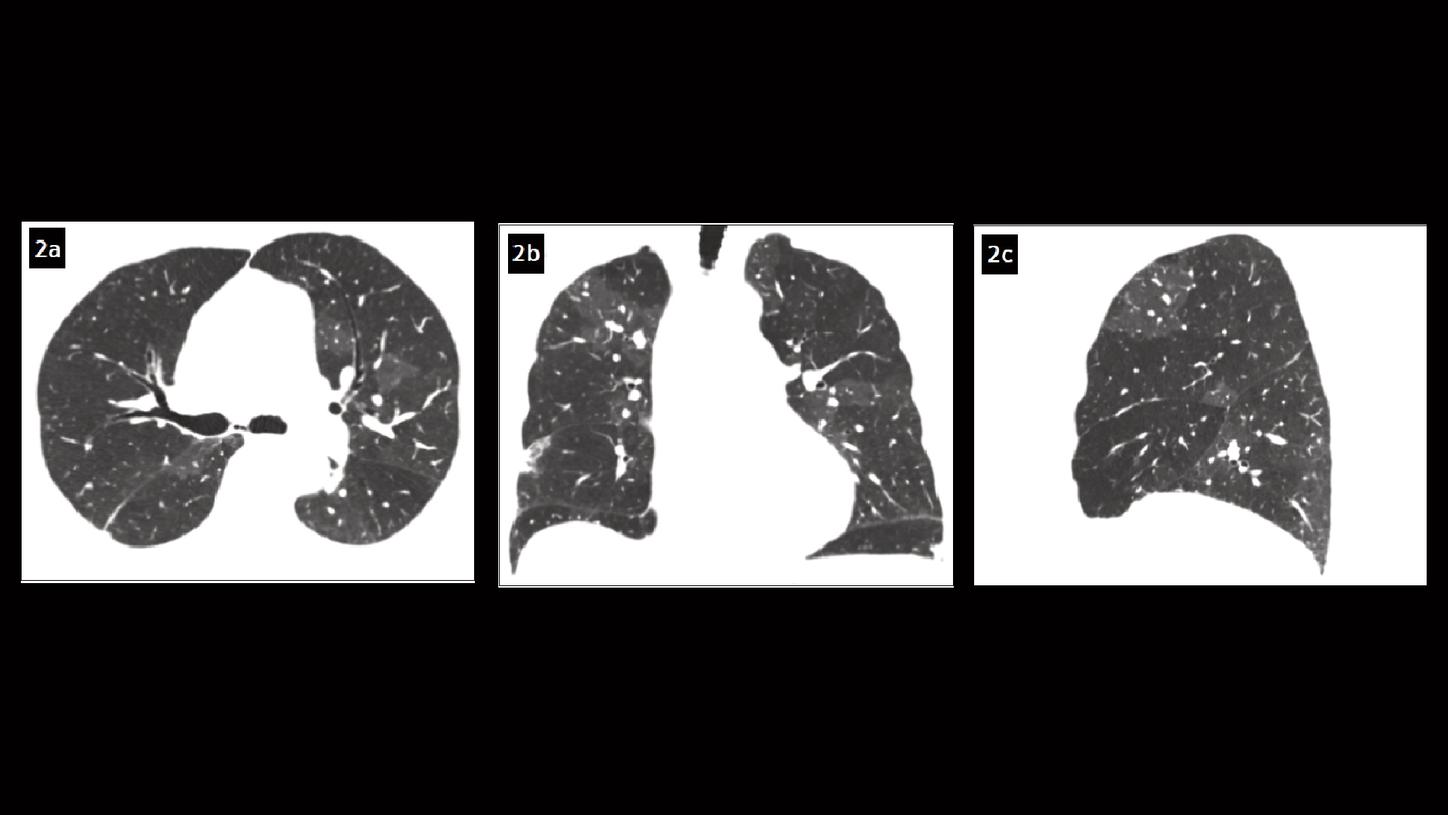
Fig. 2: Axial (Fig. 2a), coronal (Fig. 2b) and sagittal (Fig. 2c) MPR images show a pattern of mosaic perfusion in both lungs.

Courtesy of Department of Thoracic Imaging, University Centre of Lille, France
Fig. 3: Cinematic VRT images show the dilation of the central PA, tapering and pruning of the peripheral PA, as well as a dilated bronchial artery (arrow, Fig. 3b).

Courtesy of Department of Thoracic Imaging, University Centre of Lille, France
Fig. 4: Sagittal (Figs. 4a & 4c) and coronal views (Fig. 4b) of the LungPBV image show multiple peripheral wedge-shaped perfusion defects bilaterally.
Comments
PH is a hemodynamic condition defined by a mean PA pressure (PAP) greater than 20 mm Hg and is clinically classified into five different groups, sharing similar pathophysiologic mechanisms, hemodynamic characteristics and therapeutic management. [1] CTEPH is classified in group 4 in which pulmonary artery obstructions are responsible for PH. The incidence of PE in the context of COVID-19 has been reported but there is no data on post COVID-19 CTEPH. [2] An acute PE may lead to CTEPH due to an abnormal persistent obstruction of the PAs by residual organized thrombi, combined with a variable degree of microscopic vasculopathy. CTEPH has a poor prognosis when left untreated, leading to right heart failure as a result of progressive right ventricular dysfunction. An early recognition of CTEPH is essential since chronic thromboembolism is potentially curable using PTE. Lately, the role of CT in the diagnostic approach of PH etiology has been evolving and the growing importance of modern CT techniques in the diagnosis of CTEPH has been reinforced.
This case was performed with NAEOTOM Alpha, a newly developed CT scanner with photon-counting detectors, providing energy-resolved CT data at improved spatial resolution, with inherent spectral information and improved tissue contrasts, without electronic noise. [3] All of these contribute to benefits and improvements in chest CT imaging. As an example, the iodine contrast-to-noise ratio (CNR) is improved due to the missing down-weighting of the lower energy X-ray photons and the absence of electronic noise, prompting a potential reduction of the radiation dose and the amount of contrast agent needed. Another benefit is the availability of spectral CT data in each contrast scan, i.e., the iodine maps – also known as LungPBV – can be created with each CTA dataset, resulting in a simultaneous assessment of the pulmonary vasculature as well as analysis of the parenchymal iodine distribution. Due to the high scan speed, spectral data of the entire thorax can be obtained in less than 2 s. This has a major impact on improving routine workflow. In the clinical context of PH, previous studies have shown agreement between LungPBV and scintigraphy for the detection of perfusion defects. [4] As shown in this case, chest CTA helped the radiologist to assess the presence of CT features of a chronic PE and to identify a dilation of pulmonary arteries and right ventricular dysfunction secondary to PH. CTEPH was clearly assessed as the etiology of PH, which helped the physician to make a proper treatment plan for the patient.
Examination Protocol