History
A 64-year-old female patient had undergone nephrectomy twelve years ago due to T2 N0 M0 clear cell renal cell carcinoma (ccRCC). One year later, a single lymph node metastasis was found, which triggered systemic therapy with sunitinib over two years, resulting in compete response. However, the therapy was re-started six years later after an adrenal metastasis occurred which was treated surgically as well. On a recent follow-up CT, another novel lesion was visualized in the pancreatic head. This partially obstructed the portal vein, raising the concern of either tumor invasion or thrombus formation. For further assessment and surgical planning, a three-phase (arterial, pancreatic, venous) contrast-enhanced CT scan was requested and performed on our newly installed photon-counting CT (PCCT).
Diagnosis
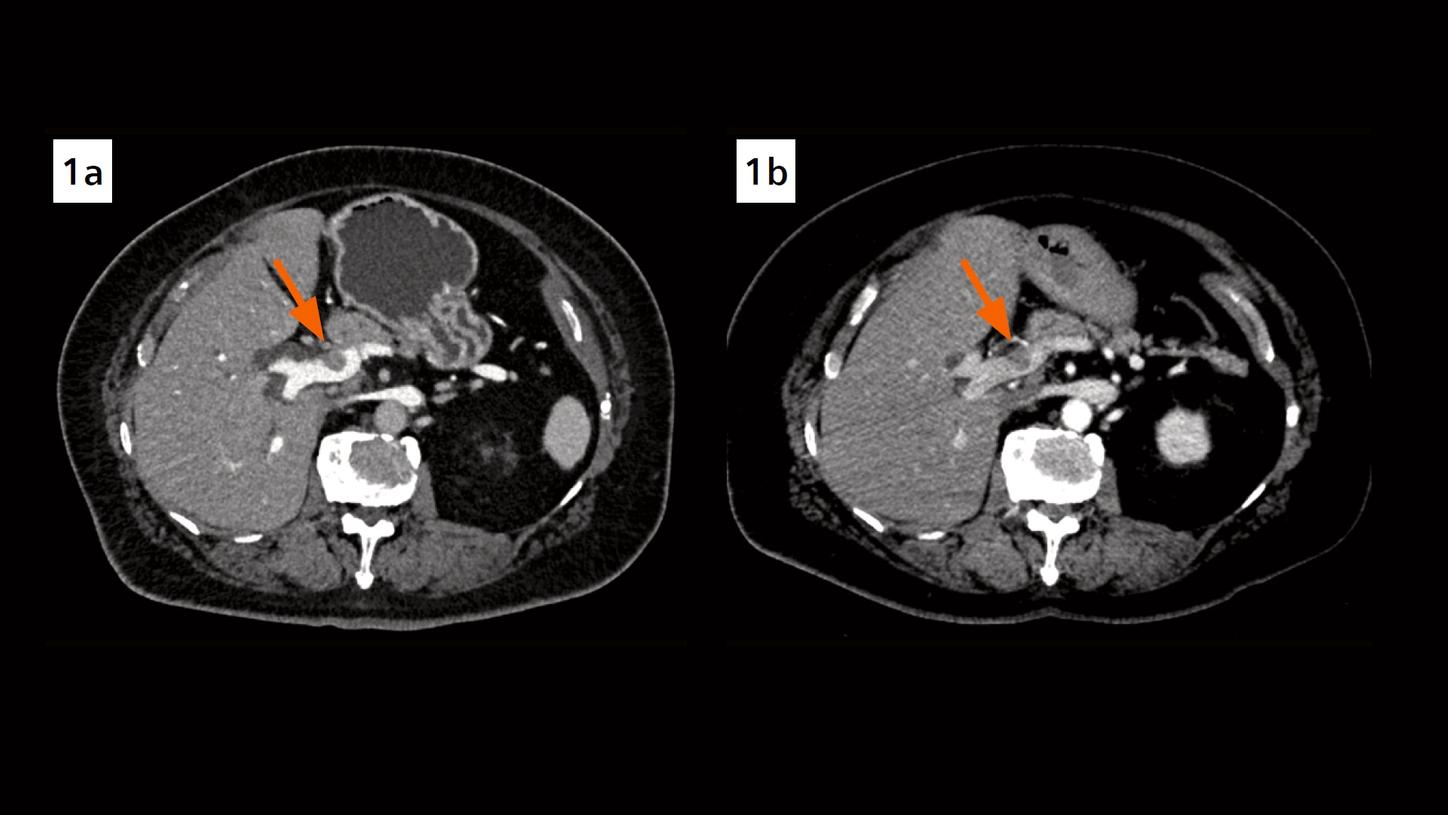
CT images of the native scan showed an enlarged, isodense pancreatic head, in which a hypo-attenuating, well circumscribed mass measuring 4.5 x 4.0 x 6.7 cm was depicted in the virtual-monoenergetic images displayed at 65 keV in the pancreatic phase. The mass was iso-attenuating in both the arterial and venous phases, showing delayed enhancement. It extended into the portal vein, causing a partial dislocation and obstruction without signs of invasion. No biliary or pancreatic duct obstruction was present. CT findings suggested a surgically resectable tumor, accounting for the possibility of an atypical pancreatic neuroendocrine tumor (pNET), or an atypical ccRCC metastasis, or an adenocarcinoma. The patient was then referred to endoscopic ultrasound (EUS) with biopsy. Histological analysis resulted in a pNET and the patient was scheduled for surgery.

Fig. 1: A comparison, between an axial image acquired on PCCT (Fig. 1a) with an axial image acquired on a conventional CT 4 months earlier (Fig. 1b), shows a clearer boundary between the lesion (arrows) and the portal vein in the former.

Fig. 2: Coronal views of a MPR (Fig. 2a) and an iodine map (Fig. 2b) show the hypodense pancreatic head lesion, extending into the portal vein (arrows) without signs of invasion.

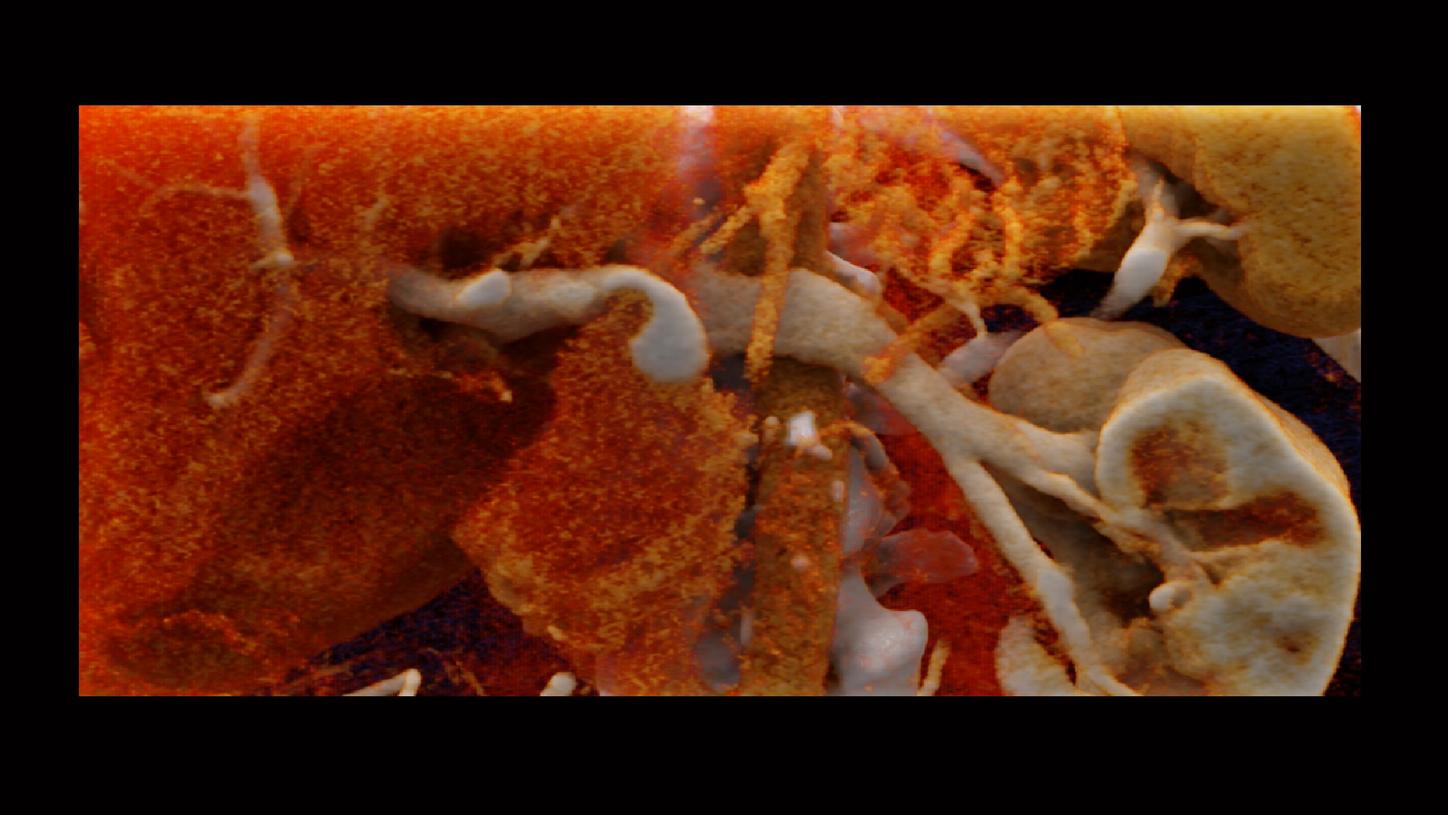
Fig. 3: cVRT images show the hypodense pancreatic head lesion, extending into the portal vein without signs of invasion, and its surrounding structures in three dimensions.
Comments
Pancreatic head masses have a broad variety of conditions. Typically, pNETs and ccRCC metastases are well-circumscribed, hypervascular lesions, best seen on (early) arterial phase and cause no significant biliary or pancreatic duct dilatation. However, although rare, atypical forms of both tumors exist, which appear as hypodense masses, mimicking pancreatic adenocarcinoma. [1,2] For differential diagnosis, the atypical form of the tumors and the medical history of the patient must be considered. Tumor resectability needs to be carefully assessed prior to surgery, where signs of tumor invasion into adjacent vessels play the crucial role. In order to deliver a diagnosis most precise, high image sharpness and low image noise are mandatory, which impose technical difficulties and challenges to conventional CT.
This case is performed on a NAEOTOM Alpha, a newly developed Dual Source CT scanner with photon-counting detectors (QuantaMax™), providing energy-resolved CT data with inherent spectral information at improved spatial resolution, without electronic noise. [3] Image acquisition with a thin slice collimation of 144 × 0.4 mm, and image reconstruction with a sharper kernel of Br44 are routinely applied for abdominal imaging, improving image sharpness while obtaining full spectral information. A refined iterative reconstruction technique (Quantum Iterative Reconstruction, QIR) is used to efficiently reduce image noise in these thin slices, without negatively affecting image sharpness or image noise texture. Owing to the availability of the spectral data and reduced image noise, virtual-monoenergetic images can be routinely displayed at lower keV levels for enhanced soft tissue contrast, and iodine maps can be reconstructed for improved visualization of boundaries differentiating the tumor from the pancreas parenchyma as well as from the portal vein. These thin slices can also be used to generate a photo-realistic three-dimensional visualization of the anatomical details using cinematic volume rendering technique (cVRT), facilitating the communication between the radiologists and the surgeons. As shown in this very rare case – an atypical pNET as a second primary tumor in a patient with a metastatic ccRCC – the combination of increased image sharpness and contrast with reduced image noise offered by PCCT improves anatomic conspicuity, enhancing the confidence of the radiologists when making a differential diagnosis and assessing tumor resectability.
Examination Protocol
