
1FY1 House Officer, Academic Track; 2Clinical Research Fellow; 3Consultant / Reader Advanced Cardiovascular Imaging; William Harvey Research Institute Barts Heart Centre / Queen Mary University of London, London, UK
History
A 53-year-old male patient, a smoker, suffering from exertional chest pain for the past 4 months, came to the hospital for a check-up. His medical history included type 2 diabetes and hyperlipidaemia. Coronary CT angiography (CTA) was performed, followed by a dynamic CT myocardial perfusion Imaging (MPI) in rest and under stress using adenosine-mediated vasodilation.
Diagnosis
Coronary CTA images showed a right coronary artery (RCA) dominant system as well as a severe stenosis in the proximal left anterior descending artery (LAD), caused by both calcified and non-calcified plaques. No significant stenosis could be visualized in the circumflex (Cx) and RCA (Fig. 1). MPI in rest showed no perfusion abnormalities in the myocardium with a normal myocardial blood flow (MBF) of 95 mL/ 100mL/ min. MPI under adenosine-induced vasodilation showed a typical increase of MBF in remote areas (165 mL/100mL/min), while there were large anterior and septal defects with a significant reduction of MBF (65 mL/100mL/min) and reduced wall thickening corresponding to severe hypoperfusion; MBF was lower than in rest (Fig. 2). The normal MPI findings in rest indicate that there was no irreversible tissue damage yet, the pronounced MBF reduction under stress is consistent with the exertional chest pain of the patient. Subsequently, the patient underwent percutaneous coronary intervention (PCI), which confirmed the CT findings and successfully restored perfusion (Fig. 3).


Fig. 1: Cinematic VRT (Fig. 1a) and curved MPR (Figs. 1b–1d) images show a severe stenosis in the proximal LAD (Fig. 1b, arrow) caused by both calcified and non-calcified plaques. No significant stenosis can be visualized in the Cx (Fig. 1c) and RCA (Fig. 1d).


Fig. 2: MBF images in both short (Figs. 2a and 2b) and long (Figs. 2c and 2d) axis reveal large anterior and septal defects under stress (Figs. 2b and 2d, arrows), and no perfusion defect in rest (Figs. 2a and 2c). Compared to a normal MBF of 95 mL/100mL/min in rest, MBF under stress is significantly reduced to 65 mL/100mL/min in the affected areas and increased to 165 mL/100mL/min in the remote areas.
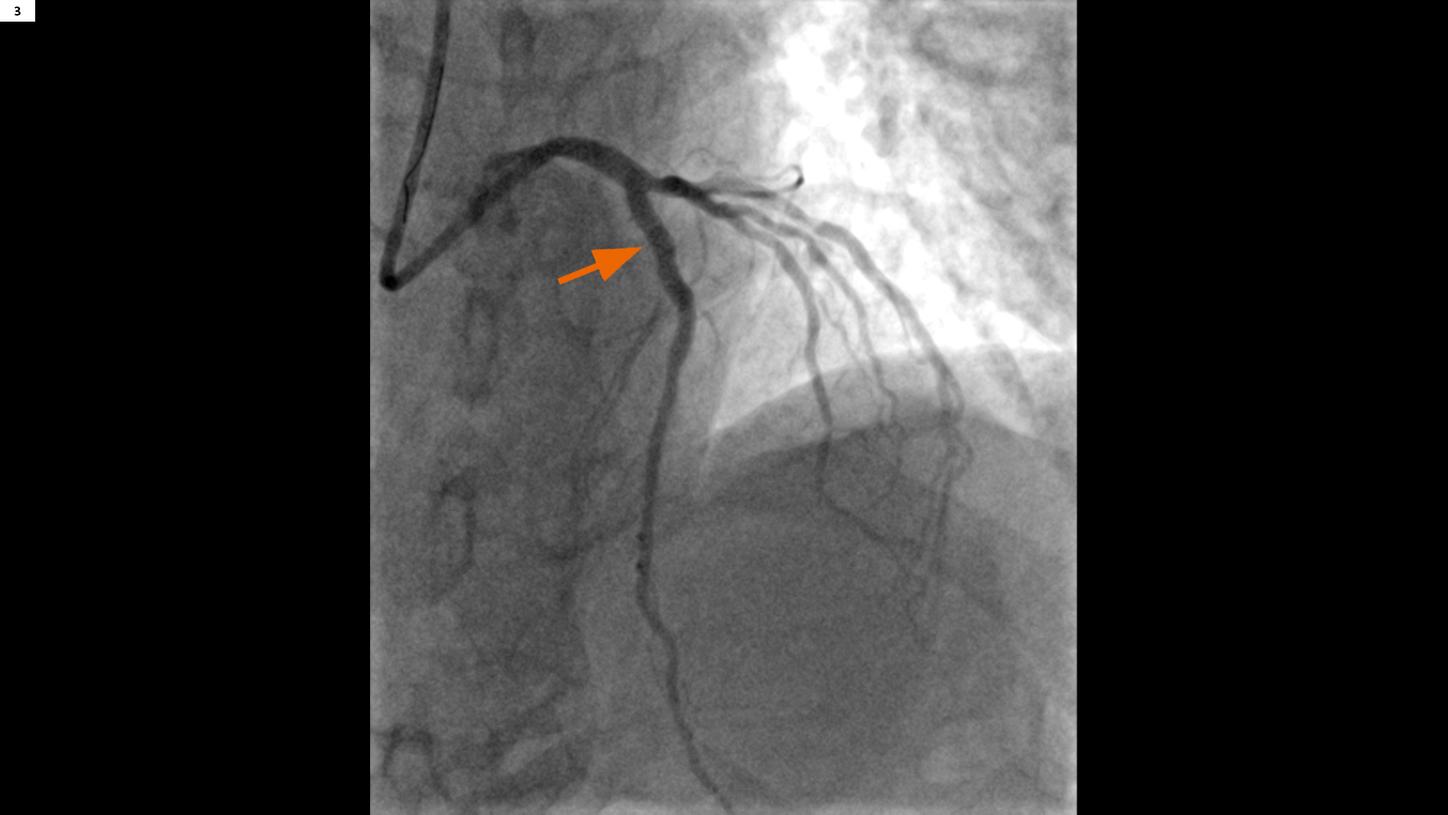
Fig. 3: A post-PCI image show a well recanalized LAD in the proximal segment (arrow).
Comments
The unique advantage of dynamic CT MPI is the potential of combining it with coronary CTA so that coronary artery stenoses and their effects on myocardial perfusion can be assessed comprehensively and noninvasively with a single modality.[1] A systolic ECG-triggered Sequential Shuttle mode is used with an absolute delay of 250 ms, which is insensitive to extra-systolic events and improves myocardial perfusion evaluation since the myocardium is thicker in systole. It is also very robust for high and varying heart rates which are common in severe cases; in this patient the heart rate varied from 65 to 105 bpm over both examinations. Quantitative myocardial perfusion CT is performed using dynamic CT scanning with contrast agent; stress is induced by adenosine-mediated vasodilation. Voxel time-attenuation curves are measured as the contrast agent passes through the heart. Perfusion parameters, such as MBF, are calculated from them using a deconvolution algorithm.[2] CARE Dose4D (Real time Anatomic Exposure Control) is routinely applied to minimize radiation exposure. If a severe coronary stenosis with significant perfusion defects in its territory under stress is detected, it is still important for therapy selection to have information concerning tissue viability: Are there areas that are already irreversibly damaged? Therefore, in selected cases it is helpful to also include a rest MPI scan, which is not routinely done when there are no concerns related to fixed perfusion abnormalities. A valid alternative to a rest perfusion scan is a late enhancement scan aimed at the visualization of myocardial scarring. In this case, MPI performed in rest was normal, which made the presence of infarcted scar tissue in the affected areas unlikely. It is noteworthy that this patient had no coronary flow reserve for the LAD territory, as MBF was reduced below rest values by a “steal effect” from the remaining myocardium as a consequence of adenosine-mediated vasodilation.