By Mario Jreige, Gilles Allenbach and J. Prior
Data courtesy of Lausanne University Hospital, Lausanne, Switzerland
History
A patient with a well-differentiated neuroendocrine tumor stage IV [HEP, LYM] of the pancreas G2, MIB1 ~5% in March 2014, was treated with different chemotherapy regimens with progressive disease until January 2016. After two peptide receptor radionuclide therapy (PRRT) cycles, the patient was referred for restaging in August 2016.
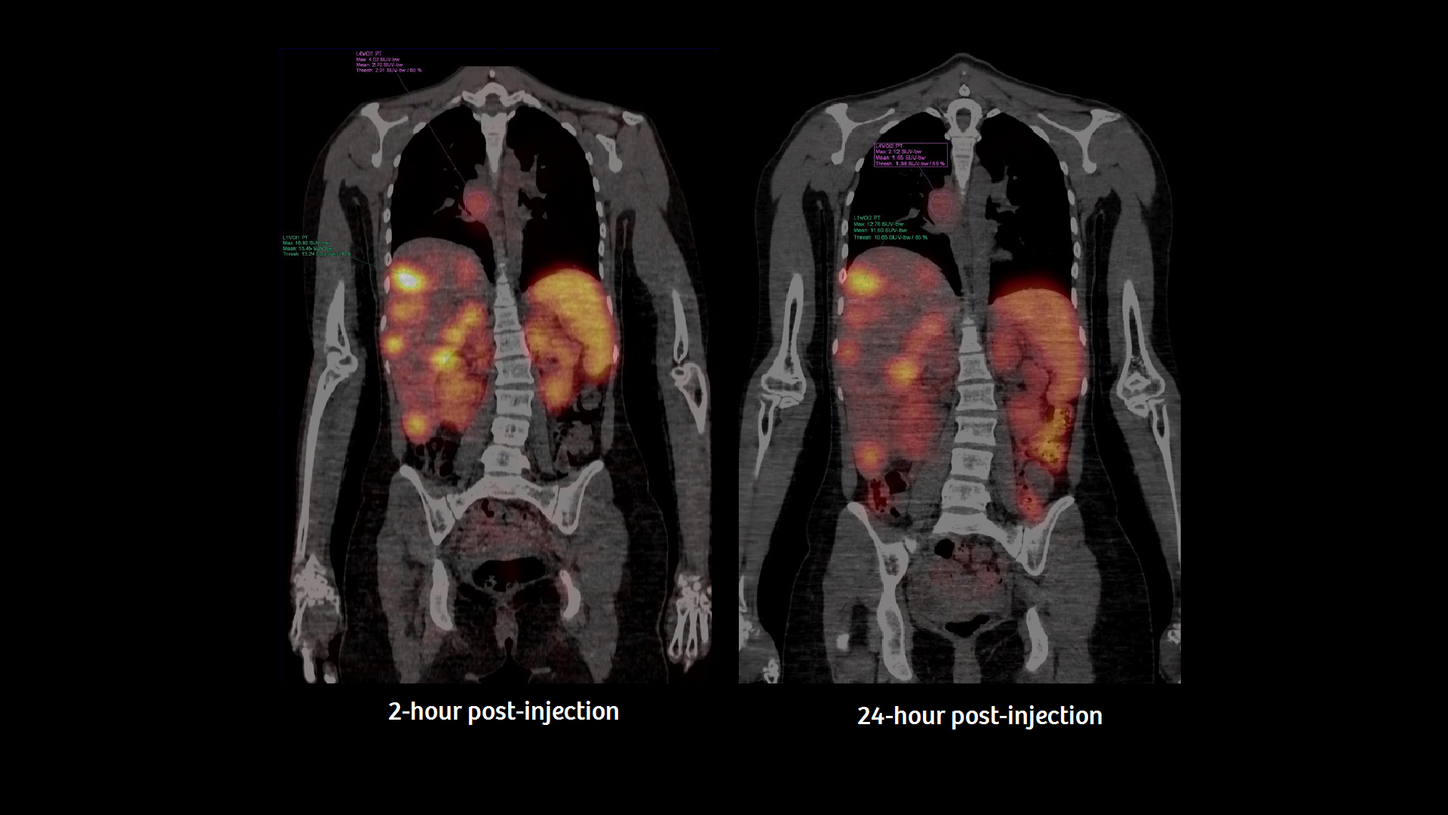
Two- and 24-hour post-injection scans were performed after 111In-octreotide using a Symbia Intevo™ 16 SPECT/CT scanner with xSPECT Quant™ technology.

Findings
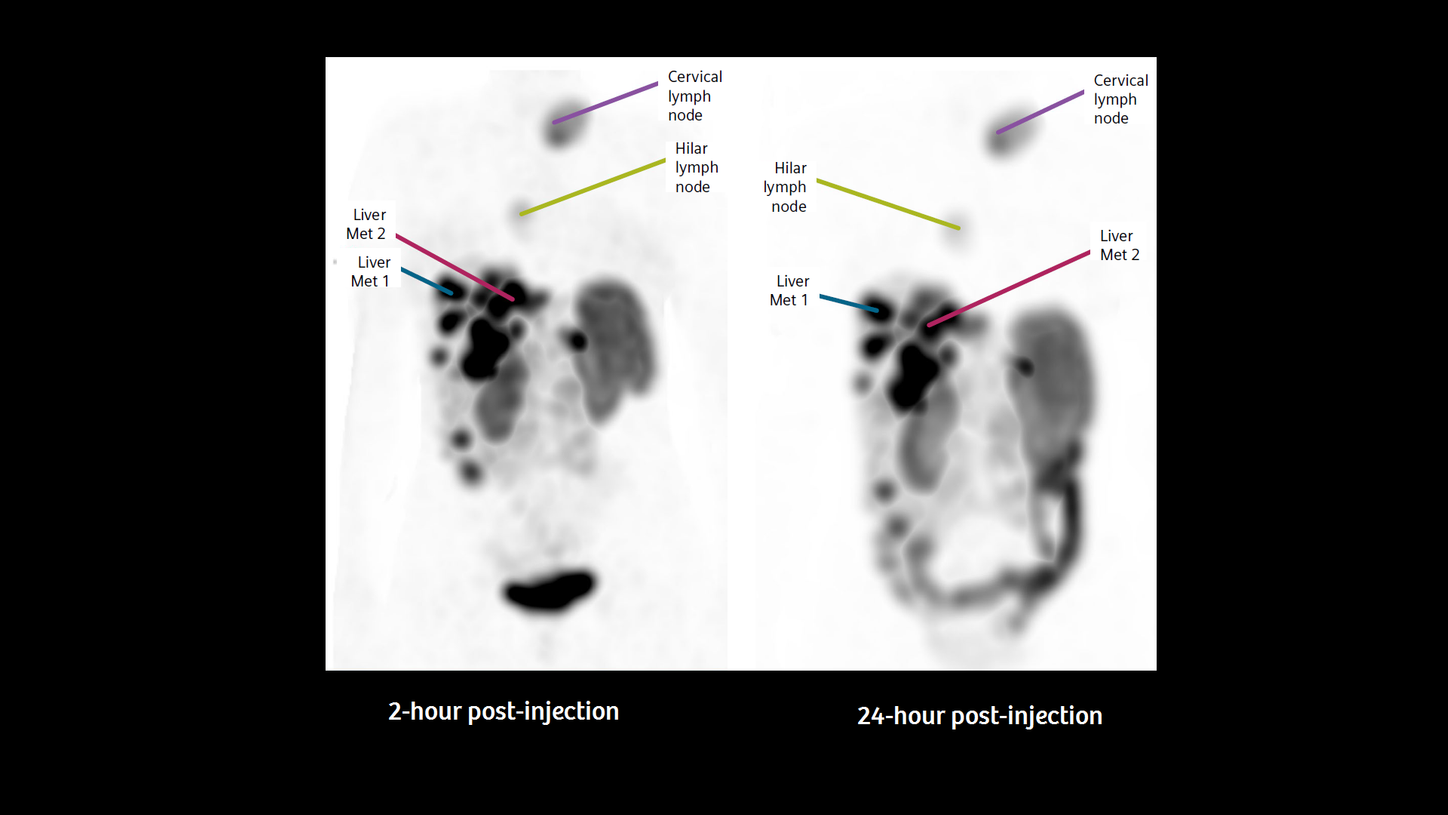
This scan demonstrated the metastatic disease with focal mass uptake in the pancreatic region as well as the disseminated spread, as shown in Figures 1 and 2. Compared to a prior examination (not shown), the final results were concluded as stable disease after PRRT.

Comments
111In-octreotide scans enable detection of several different diseases, but are mostly used in the early detection, staging and potential treatment of neuroendocrine tumors of the upper and mid-gut. With the advent of new therapy approaches in neuroendocrine tumors such as PRRT, the necessity for accurate uptake measurements has emerged. Quantitative response evaluation in neuroendocrine tumors is primarily in the domain of PET imaging, but 111In-labelled octreotide is still one of the most commonly used agents for imaging of neuroendocrine tumors in diagnosis and staging, in particular, where PET tracers are not available.1 Although it is known that there is a cor-relation of somatostatin receptor expression and the visibility in somatostatin receptor imaging, due to the lack of robust and repeatable quantification, visual scores were recommended.2 The feasibility of 99mTc-MDP quantification and its potential clinical impact was already demonstrated.3 Now, with the expansion of accurate and robust quantification using xSPECT Quant™ for additional tracers, clinicians have started to define the meaning of these uptake values.
For this case, considering the tracers’ distribution and uptake after 2 hours and 24 hours and, in particular, the uptake values calculated by SUV, one can identify and quantify the biology of the tumor’s behavior in terms of octreotide receptor binding, tracer target density, as well as the accumulation in potential organs at risk. As an example, Figure 3 illustrates the changes of the SUV between time point 1 at 2 hours, and time point 2 at 24 hours post-injection of all lesions measured in the overview in Figure 2. Using 111In, as presented here, physicians worldwide can overcome the initial and inherent limitations of regular SPECT/CT and use accurate and reproducible quantification for uptake calculations and precise follow-up evaluation.

![Plotted SUV from the four selected lesions over time [2-hr., 24-hr.], demonstrate the quantified changes of the lesions.](https://marketing.webassets.siemens-healthineers.com/1800000006215382/48416c5d4d98/v/1e417f6c7816/robust-quantification-net-imaging_Figure3_1800000006215382.png)
Conclusion
xSPECT Quant-enabled quantification for 111In helps to measure precisely the initial uptake and changes over time in primary diagnosis, treatment follow-up and treatment planning