syngo DynamicsStructured flexibility – with heart
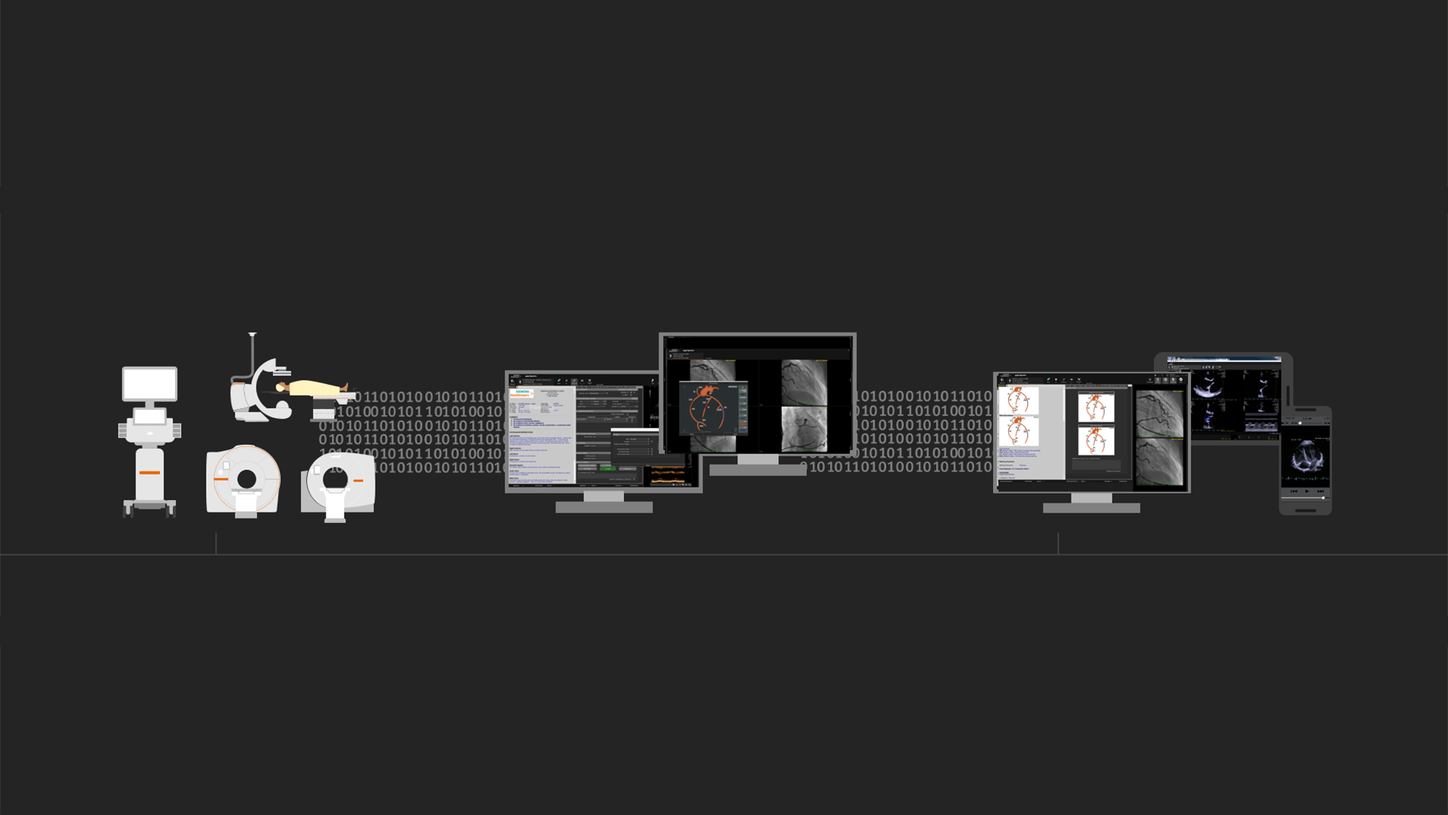
syngo Dynamics is a cardiovascular imaging and information solution designed to enable reading and structured reporting. With syngo Dynamics, access a 360-degree view of the entire cardiovascular service line.

Benefits
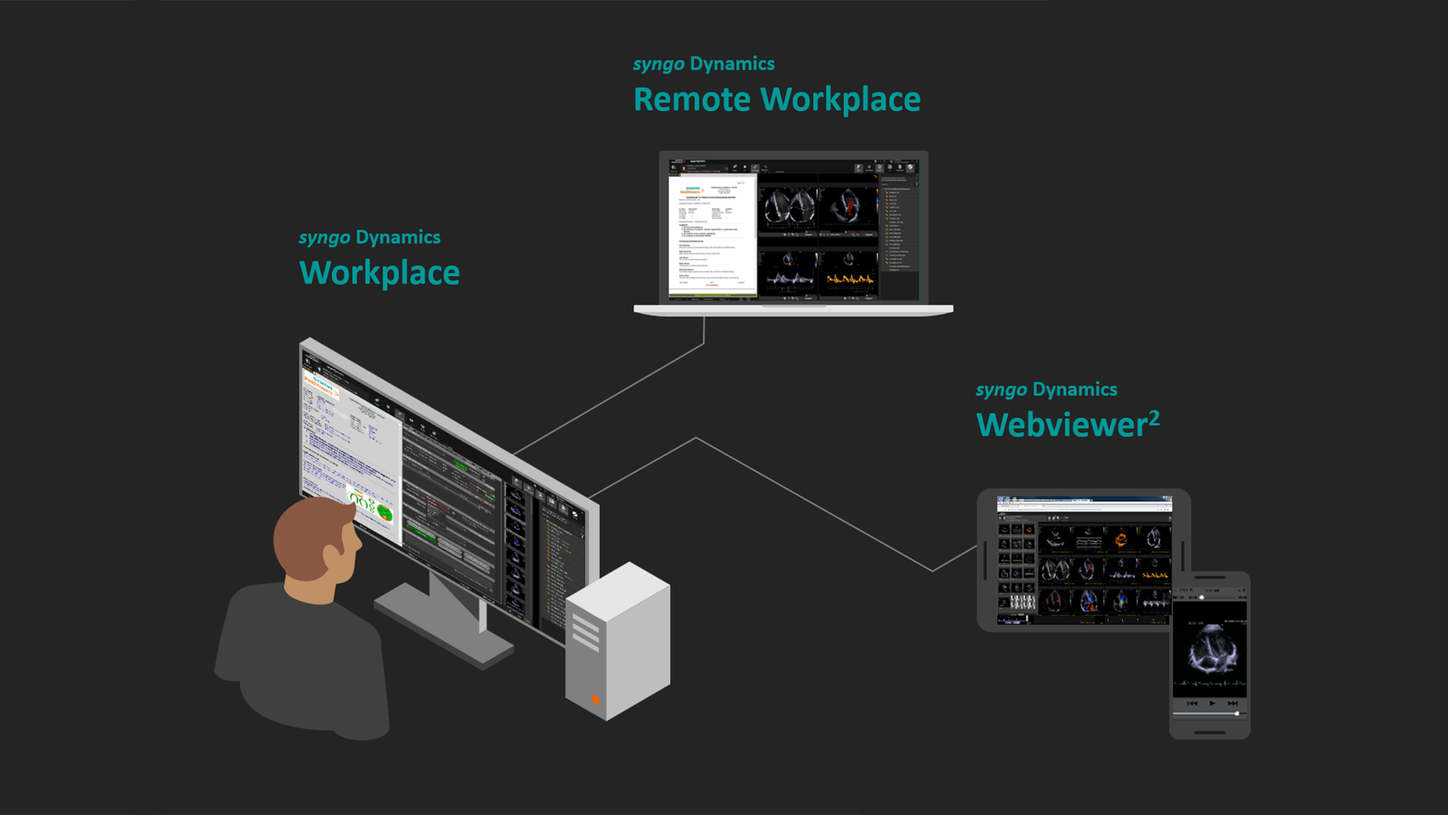
Access reading and reporting from any workplace in the organization to instantly retrieve relevant data and use enterprise search and study lists for a complete patient view across the care continuum.
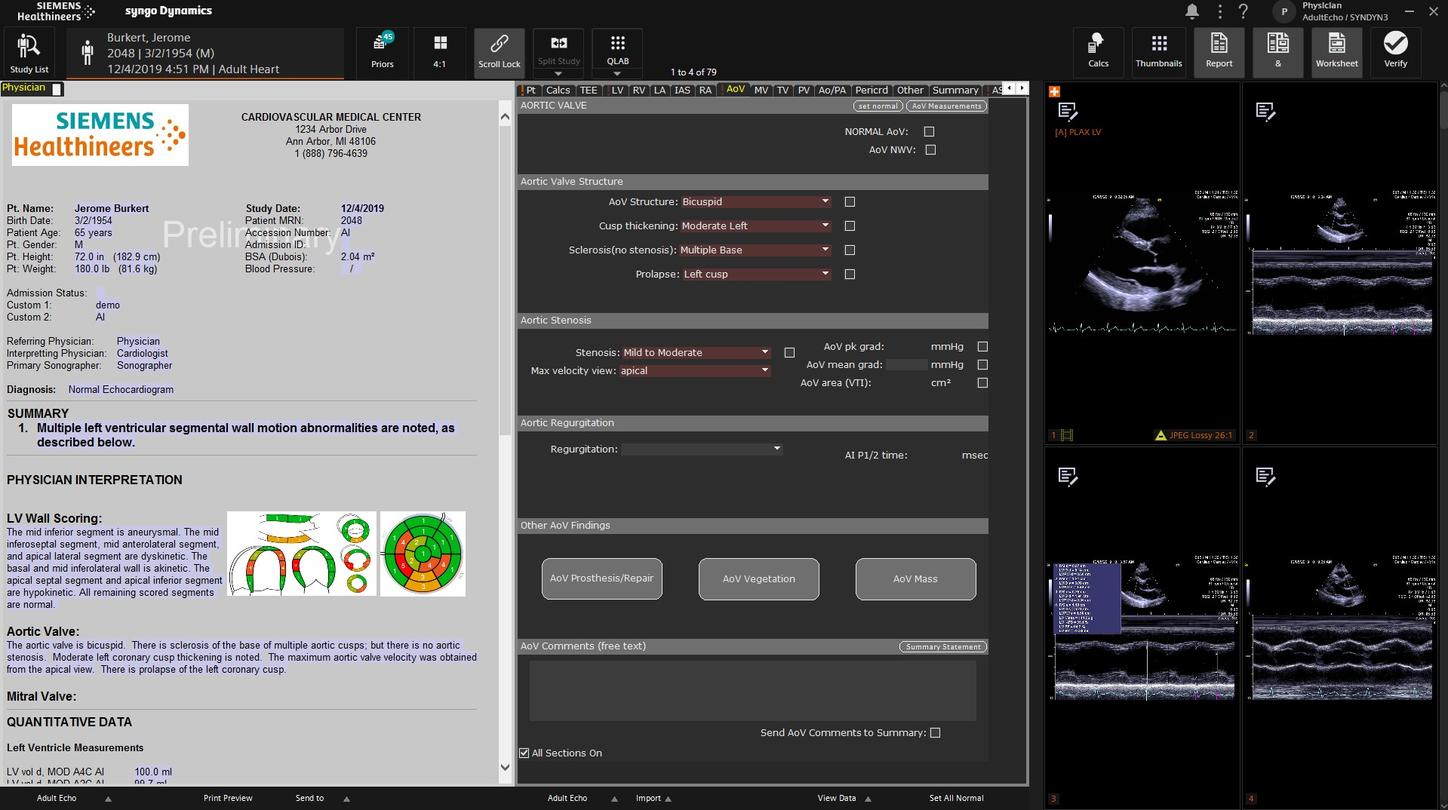
syngo Dynamics enables vendor-agnostic, semi-automated off-cart view classification and routine echo measurements directly within the application. It also supports side-by-side comparison of current and prior images from the same view.
Evidence
White paper
Explore our white papers to see how syngo Dynamics empowers cardiology teams worldwide—unifying imaging data, supporting clinical research and education, and enabling secure off-site reporting through Remote Workplace.
Enhancing cardiology workflows with integrated imaging
Consolidating extensive imaging data from multiple sources into a single platform for a more comprehensive view of patient health.
Increasing the value of cardiology reports through structured reporting
Using multi-modality structured reporting for clinical research and education.
Increasing echocardiography throughput in satellite sites during the pandemic
Deploying syngo Dynamics’ Remote Workplace to enable off-site reading and reporting.