Imaging technique
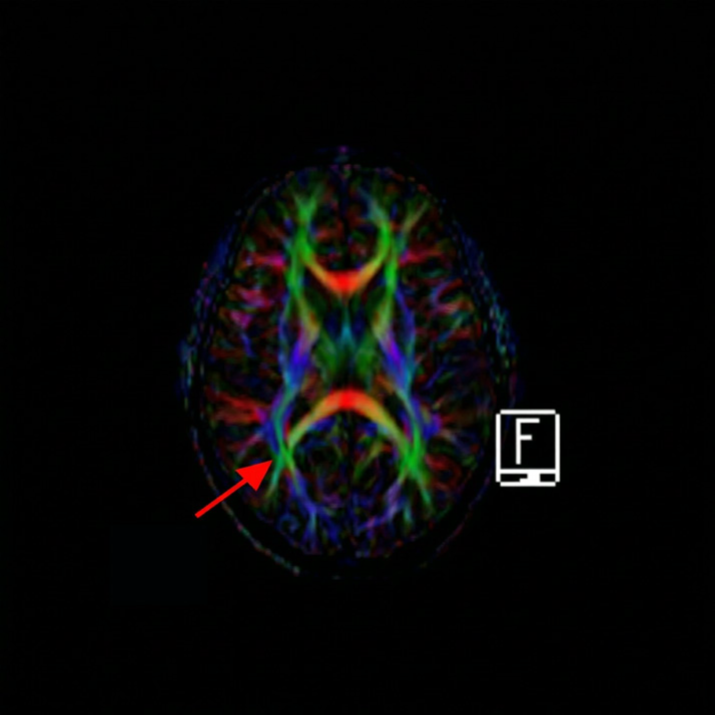
All structural and functional magnetic resonance images of the brain were obtained via using 1.5 Tesla MR unit Multiparametric imaging was carried out via using 1.5 Tesla MR unit (Syngo MR XA31; Siemens Healthcare GmbH, Erlangen, Germany) with a dedicated head coil. The obtained ASL and DTI data were processed and analyzed with motion correction, standard volume-re-alignment followed by independent component analysis-based automatic removal of motion artifacts.
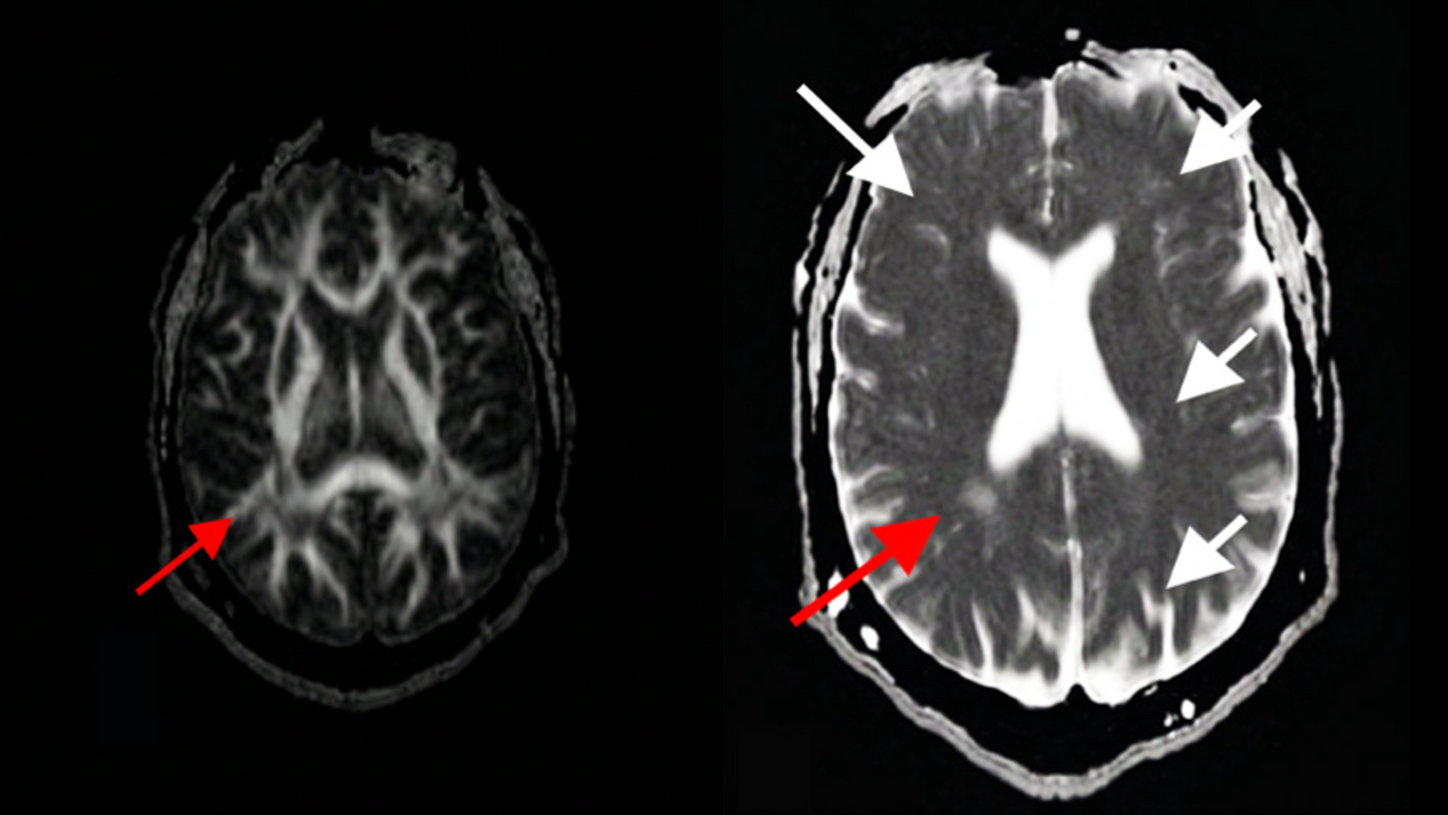
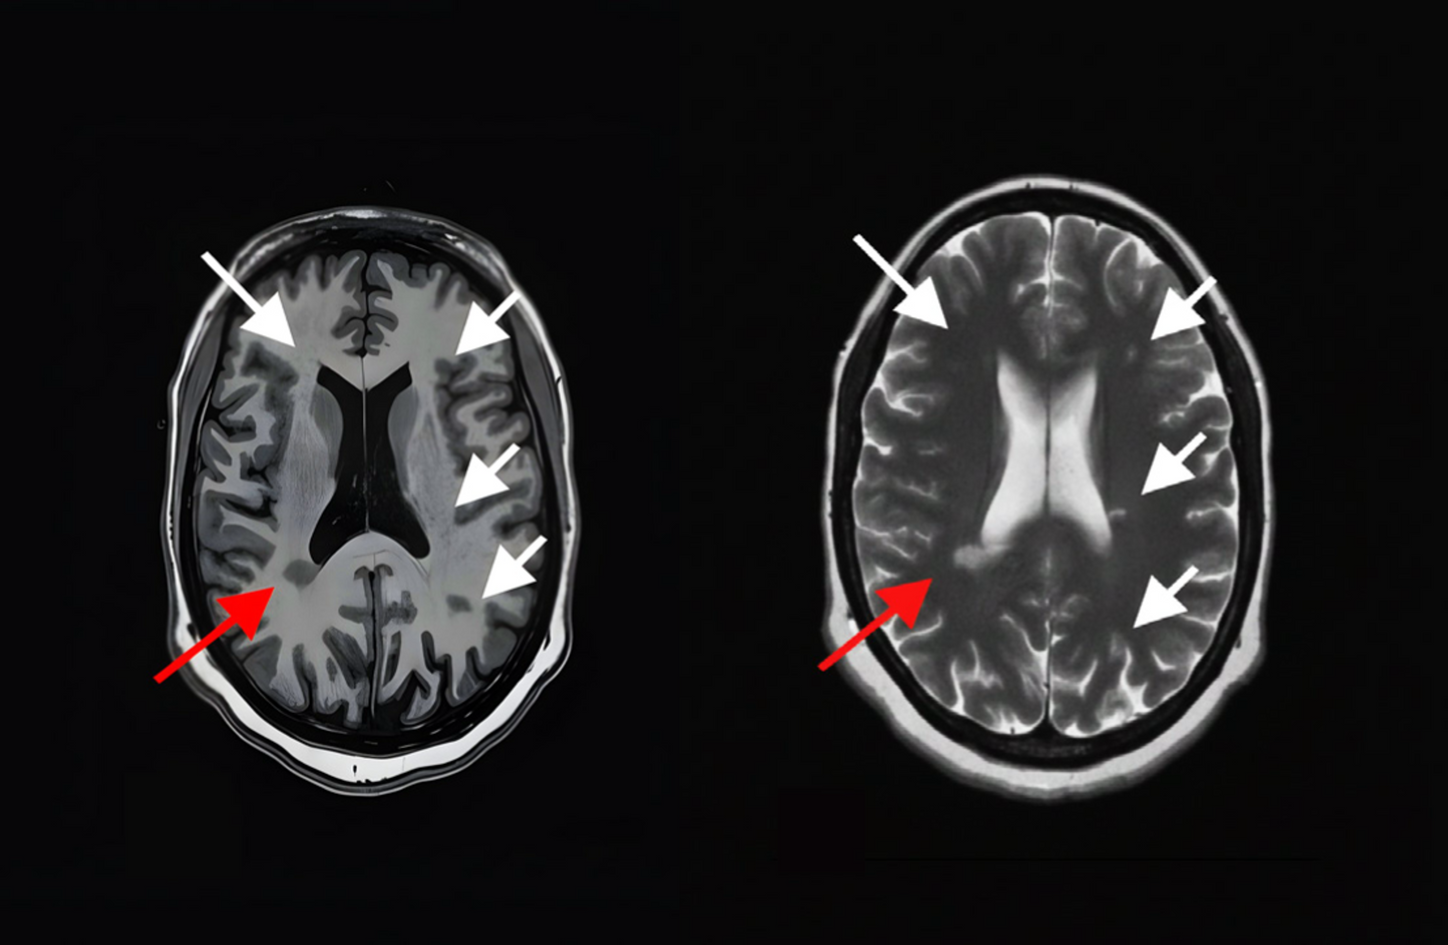
Fig B: T2 Axial
Conventional MRI protocol
• Axial T1 weighted imaging without contrast: TR 580, TE 10, matrix 80 x 80, FOV 230 x 177 & slice thickness 5 mm.
• Axial T2 weighted imaging: TR 3600, TE 90, matrix 208 x 127, FOV 230 x 177 & slice thickness 5 mm.
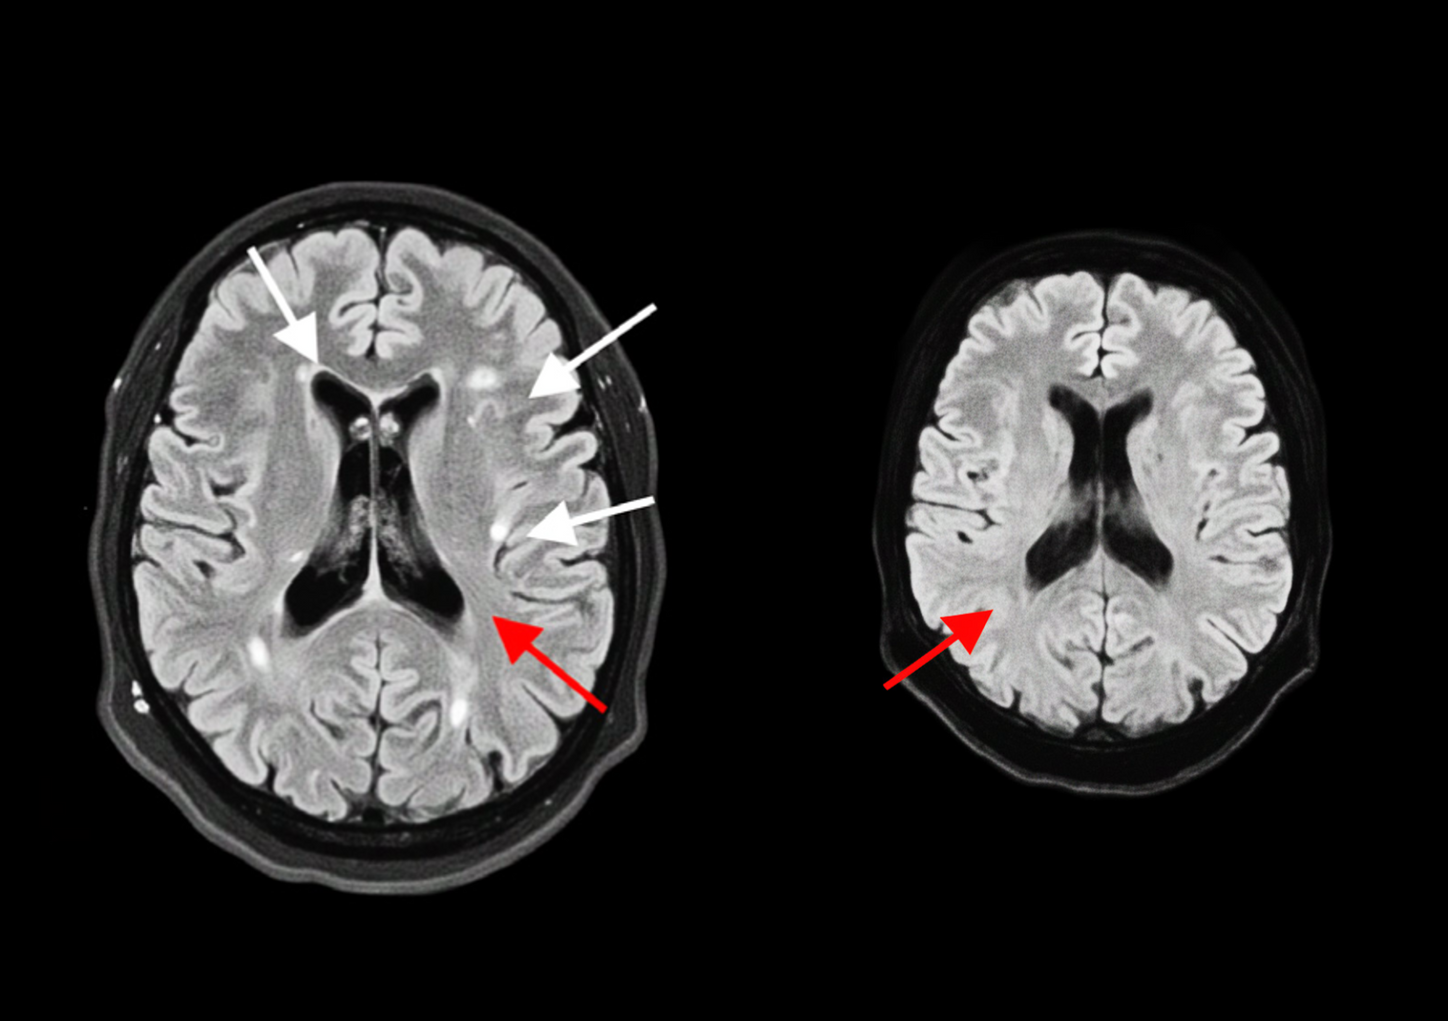
• 3D FLAIR weighted imaging: TR 7800, TE 430, matrix 240 x 130, FOV 230 x 177 & slice thickness 1.2 mm.
• The DWI and ADC values: TR: 4100, TE: 74, matrix 128 x 128, FOV 230 x 224 & slice thickness 5 mm.
Discussion
Smoldering lesions represent a pathologically distinct subset of MS lesions with a persistent rim of iron-laden activated microglia, often undetectable by conventional MRI (4). Brain and spinal cord imaging plays a crucial role in aiding clinicians with the diagnosis and monitoring of MS. Nevertheless, the significance of MRI in MS extends beyond its clinical utility (6). The multi-parametric MRI tools have emerged, offering objective measures of microstructural damage, iron deposition, and axonal integrity. Moreover, advanced imaging modalities have facilitated the in vivo detection of various components of MS pathogenesis. They offer non-invasive ways to visualize and analyze the smoldering lesions within the brain and spinal cord.
Noteworthy, in recent years, MRI biomarkers have been utilized to assess the response of patients with relapsing-remitting MS to the available treatments. By bridging imaging findings with pathophysiology, clinicians can more confidently detect early smoldering disease and initiate appropriate potentially disease-modifying interventions ahead of clinical progression.
Similarly, MRI indicators of neurodegeneration demonstrate potential as primary and secondary endpoints in clinical trials targeting progressive phenotypes (7-9).
Conclusion
Multiparametric MRI, provides a robust framework for the detection and characterization of chronic active MS lesions (smoldering lesions). These imaging techniques offer complementary insights into lesion biology, allowing for improved disease monitoring, risk stratification, and treatment planning. As demonstrated in this case, such a multimodal approach may reveal clinically silent yet biologically active lesions, highlighting the importance of expanding MRI protocols in MS management. Additionally, the integrating SWI with quantitative susceptibility map, pseudo-continuous ASL, as well as DTI and tractography into clinical practice, particularly in patients with stable MS who present with subtle cognitive decline or other non-relapsing symptoms, could improve the follow up of the disease progression and support earlier therapeutic intervention to mitigate disability.