By Alexandra Lazar, MD1,2, Axel Rominger, MD1, and Hasan Sari, PhD1,3
Data and images courtesy of Inselspital Bern, Switzerland
History
Glioblastoma is the most common primary malignant brain tumor in adults with poor prognosis with median survival of 14-18 months4 despite aggressive multimodal treatment consisting of surgical resection, localized radiation therapy, and adjuvant chemotherapy. One of the major challenges during post-treatment glioma evaluation is differentiating true tumor recurrence from treatment-related changes, including pseudoprogression and radiation necrosis. Although contrast-enhanced magnetic resonance imaging (MRI) is widely used for staging and post-therapy follow up of glioma, it cannot reliably distinguish between actively proliferating recurrent or residual tumor and treatment-induced changes. Consequently, recurrent tumor, pseudoprogression, radiation-induced inflammation, necrosis, and fibrosis often exhibit overlapping features in MRI images, limiting diagnostic accuracy.
Radiotherapy can induce local inflammation and edema which may cause a transient increase in lesion size and Gd enhancement on serial contrast-enhanced (CE) MRI 6 months after radiotherapy, known as pseudoprogression. Delayed post treatment changes may include radiation-induced necrosis and fibrosis, which typically occur between 6 months and 2 years after radiotherapy and may demonstrate contrast enhancement, making them difficult to distinguish from recurrent tumor. Accurate differentiation between tumor recurrence and post-radiation changes is therefore essential for appropriate patient management. Although contrast-enhanced MRI, perfusion imaging, and MR spectroscopy may improve diagnostic assessment, their accuracy remains limited. White certain contrast enhancement patterns on MRI, such as “Swiss cheese enhancement,” are more suggestive of radionecrosis, no MRI feature is sufficiently specific to reliably exclude recurrent tumor.5
In this context use of amino acid analog O-(2-[18-F-fluoroethyl)-L-tyrosine (18F-FET) PET/CT has been shown to have a major impact on accurate differentiation of glioma recurrence from treatment-related changes, owing to its biological particularities. Unlike contrast-enhanced MRI, 18F-FET uptake is largely independent of blood-brain barrier disruption and is primarily related to amino-acid transport, particularly through L-type amino-acid transporters that are upregulated in glioma cells. In static 18F-FET PET/CT glioma evaluation, the tumor-to-background ratios (TBRmax or TBR mean) are traditionally used to differentiate tumor recurrence from non-tumoral therapy changes. A TBRmax > 2 is usually associated with tumor recurrence. 6,7,8 However, TBRs are influenced by technical factors including tumor delineation, scanner spatial resolution, reconstruction settings, and post-reconstruction image filtering. Furthermore, despite using established thresholds, considerable overlap may still remain between recurrent tumor and treatment-related changes, particularly in borderline cases.
Using dynamic 18F-FET PET has further enhanced the diagnostic accuracy for differentiating tumor recurrence from treatment-related changes. 18F-FET PET time activity curves (TACs) show different patterns between tumor recurrence and treatment-related changes, with early peak and subsequent washout commonly associated with recurrence, and slowly increasing curves suggestive of treatment-related changes. However, TAC interpretation is not always definitive, as overlapping and intermediate patterns may occur, limiting its reliability in equivocal cases. In a recent study, Jang et al. (2026) performed dynamic 18F-FET PET in 66 patients with suspected recurrence or radiation-induced changes.9 TACs with slow rise and no peak (Type 1) were more consistent with radiation changes, while TAC with early peak < 20 minutes followed by rapid descent (Type 3) were typically associated with tumor recurrence. TAC with late peak > 20 minutes followed by rapid descent (Type 2) were considered indeterminate.
The clinical relevance of differentiating tumor recurrence from radiation changes and the challenges with MRI and 18F-FET PET suggest the potential of dynamic 18F-FET PET-derived parametric maps, especially Patlak-derived Ki and distribution volume (DV) maps for improving lesion characterization. The added value of parametric maps is additional parameter generation and transformation of dynamic 18F-FET PET information into voxel-wise parametric images that can be interpreted alongside conventional standardized uptake value (SUV) images and MRI. In the post-treatment glioma setting, where contrast enhancement and static amino-acid uptake may be difficult to interpret, direct Patlak Ki and DV maps may provide a spatial representation of tracer kinetics within the lesion and surrounding brain tissue. This is particularly useful in borderline cases, where static TBRs are close to established thresholds and visual assessment of TAC alone may be less representative for routine clinical interpretation.
In this context, a long axial field of view (LAFOV) PET/CT scanner such as Biograph Vision Quadra is well suited for dynamic parametric imaging. The extended axial coverage allows simultaneous brain and thoracic aorta imaging, enabling extraction of an image-derived input function (IDIF) from the descending aorta while the head remains centered in the field of view for maximum system sensitivity. Compared with carotid-based input functions on conventional axial field of view systems, an aortic IDIF is less susceptible to partial-volume effects and image noise, facilitating accurate parametric image generation.
Clinical examples
The following two examples were selected from a dynamic 18F-FET PET study performed at Inselspital Bern Switzerland using Biograph Vision Quadra, which was presented at SNMMI 2026.10 Dynamic 18F-FET PET data were acquired over 40 minutes following intravenous bolus injection of approximately 250 MBq (6.7 mCi) of 18F-FET, with the patients head placed at the center of the field of view. List-mode data was reconstructed using a 45-frame protocol. Last 20 minutes of the PET data were used to reconstruct static PET images. IDIF was extracted using an automatic deep-learning method from a vessel-aligned cylindrical VOI with 10 mm diameter placed within the descending thoracic aorta, acquired simultaneously due to the 106 cm FOV of the system. Suspected tumor volumes of interest (VOI) were segmented using an isocontour, while a crescent-shaped VOI was placed in the healthy contralateral hemisphere to assess background activity. Direct Patlak parametric images were reconstructed using proprietary software. Conventional tumor-to-background ratios (TBRmean, TBRmax) were obtained from static images.
Case 1: Pattern suggestive of tumor recurrence
A male patient in his late sixties with isocitrate dehydrogenase (IDH)-wildtype glioblastoma, WHO grade 4, was referred for dynamic 18F-FET PET/CT because of suspected tumor relapse in a post-treatment setting. The patient also had a documented history of prior radiation necrosis, making it clinically challenging to interpret new contrast enhancement.
On contrast-enhanced MRI, a focal enhancing lesion was visible in the left periventricular region. Static 18F-FET PET showed focal uptake corresponding to the MRI abnormality, with TBRmax 3.95 and TBRmean 3.54. These values were above commonly used thresholds and were already highly suggestive of tumor recurrence. Direct Patlak parametric maps provided similar kinetic information. The lesion was visually conspicuous on both Ki and DV maps, with particularly clear lesion-to-background contrast on the DV image. Lesion DV was 1.1992 mL/cc, while Ki was Ki 0.0027 mL/cc/min.
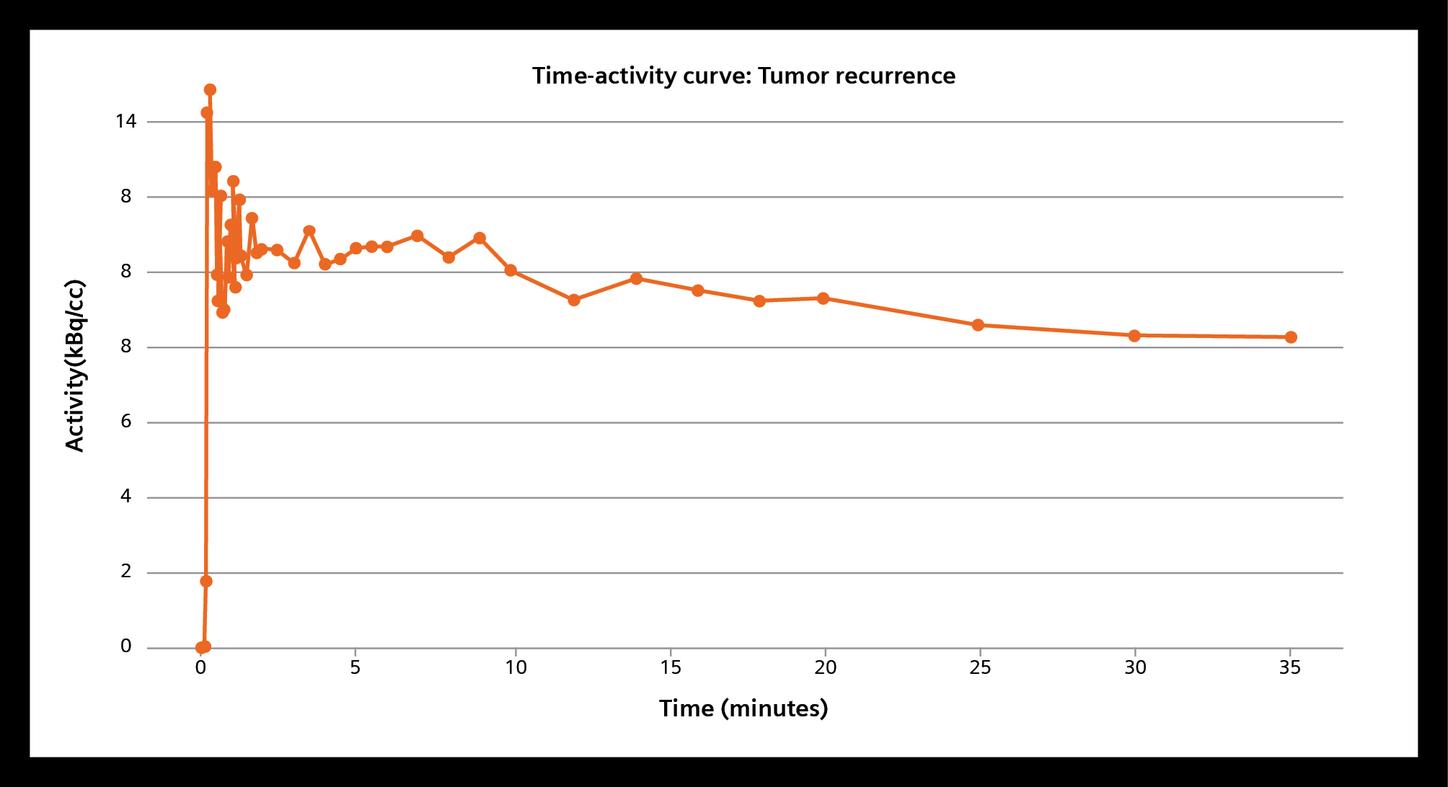
TAC pattern derived from dynamic 18F-FET PET with early peak and subsequent washout also suggested tumor recurrence. The patient subsequently underwent chemotherapy and remains alive as of this publication.
Case 1
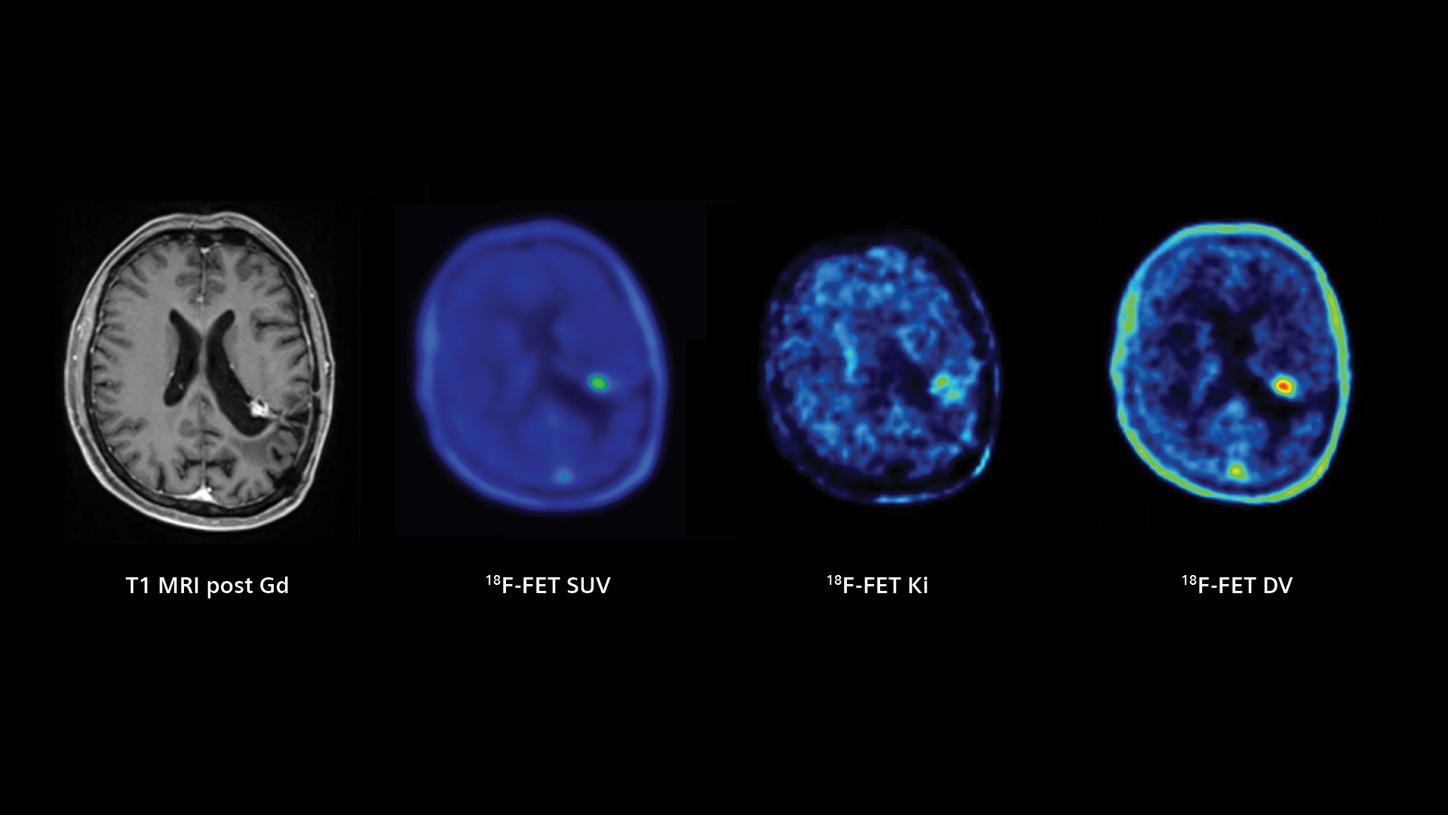
Figure 1: Axial images of contrast-enhanced T1-weighted MRI, static-18F-FET SUV image, direct Patlak Ki map, and direct Patlak DV map in a recurrence-suggestive left periventricular lesion. Static SUV is high, and the lesion is also spatially visible on the parametric images, particularly on the DV map.
Case 2: Pattern suggestive of treatment-related change in a borderline static PET case
A male patient in his early sixties with IDH-wildtype glioblastoma, WHO grade 4, underwent surgery followed by radiotherapy. Dynamic 18F-FET PET/CT was performed because of suspected tumor relapse at the surgical margin.
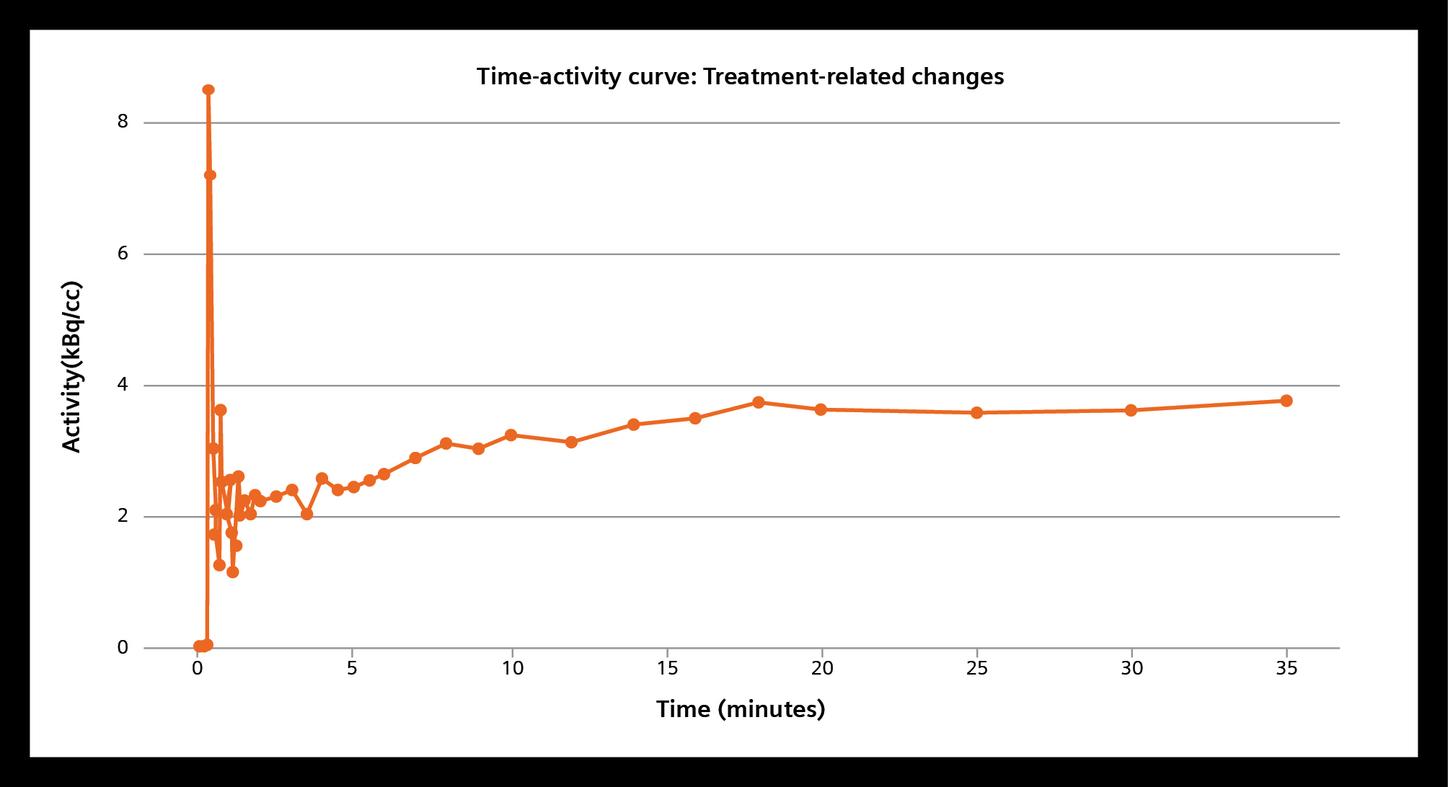
MRI showed mild contrast enhancement along the left parietal resection margin. SUV images showed low level uptake in the suspicious lesion in the corresponding area, with TBRmax 2.27 and TBRmean 1.70. This represented a borderline finding, as the values are in the “grey zone.” In this context, direct Patlak imaging was useful because the DV map did not show a focal high-contrast abnormality comparable to the recurrence-suggestive case. The lesion Ki was 0.0079 mL/cc/min, while lesion DV was 0.2264 mL/cc, which is much lower than that of the recurrent tumor (Figure 1). Together with the slowly increasing TAC pattern without a clear early peak (Figure 4), the integrated imaging appearance favored treatment-related change rather than metabolically active tumor recurrence.
Case 2
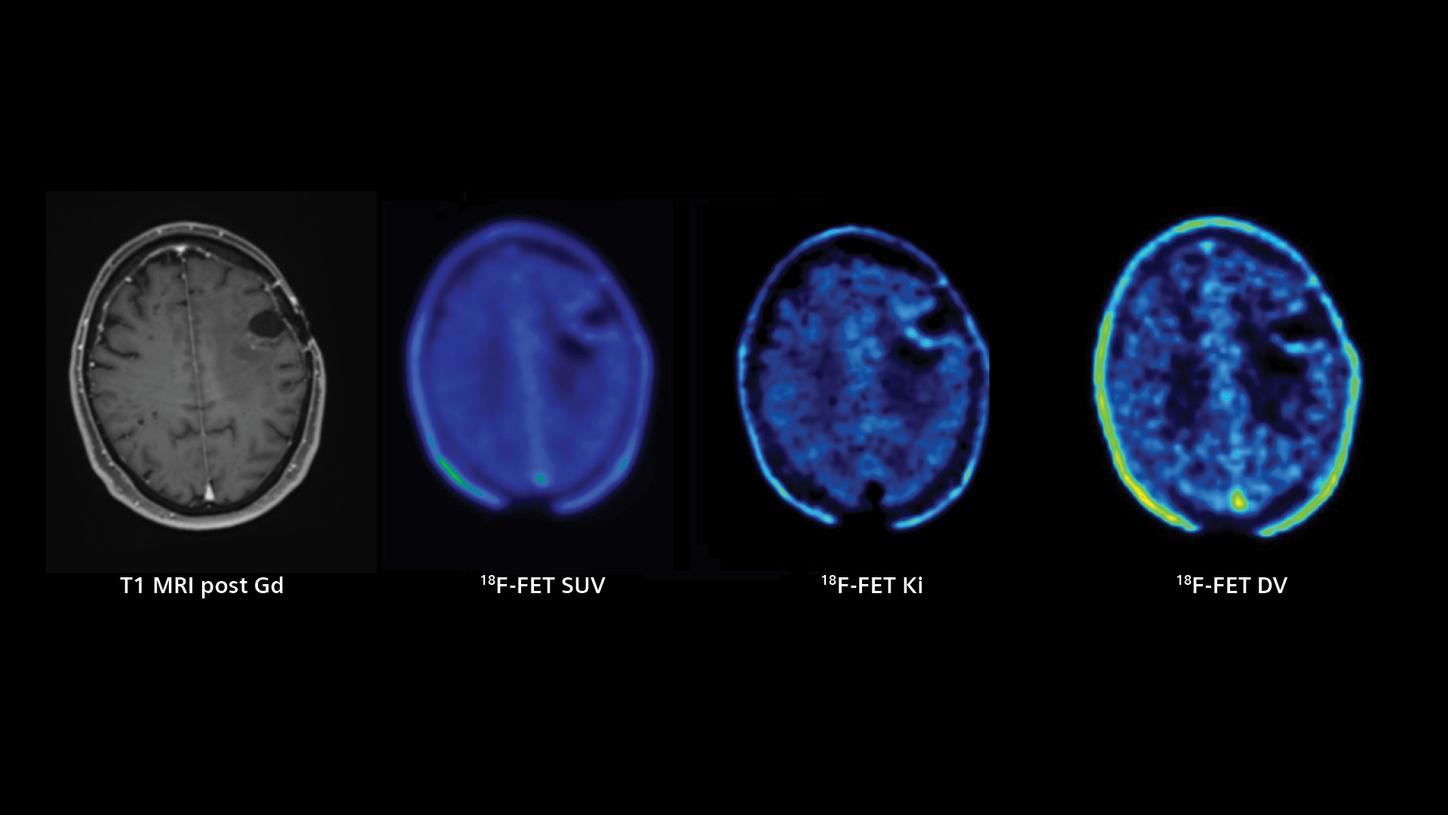
Figure 3: Contrast-enhanced T1-weighted MRI, static 18F-FET SUV image, direct Patlak Ki map, and direct Patlak DV map at the left parietal resection margin. Static uptake is borderline/low, and the direct Patlak maps do not show a focal high-contrast pattern comparable to the recurrence-suggestive case.
Discussion
These two clinical examples illustrate how direct Patlak parametric imaging can support dynamic 18F-FET PET interpretation in assessing post-treatment glioma. In the recurrence-suggestive case, static tracer uptake was clearly abnormal, and the TAC demonstrated the characteristic early peak followed by washout. Here, direct Patlak maps did not alter the diagnostic interpretation; rather, they confirmed the abnormality in a voxel-wise image format and showed the spatial heterogeneity of the lesion.
The second case better demonstrates the potential clinical value of the technique. When static 18F-FET uptake is borderline, with a TBRmax close to the commonly used threshold, a single static metric may be difficult to interpret, especially in the presence of post-surgical and post-radiotherapy MRI changes. Direct Patlak maps translated the dynamic acquisition into images that could be reviewed directly with MRI and SUV images, supporting an interpretation favoring treatment-related change when combined with the TAC pattern.
In the broader study cohort, Lazar et al. (2026)10 observed that reversible graphical analysis-derived volume of distribution (RE-VT) showed the strongest diagnostic performance for differentiating tumor recurrence from treatment-related changes. However, direct Patlak-derived DV images showed comparable lesion quantification and provided a practical surrogate measurement. Unlike full kinetic modelling, which requires dedicated post-processing and may be less accessible in routine clinical workflows, direct Patlak reconstruction enables voxel-wise parametric maps to be generated directly from the dynamic acquisition on the scanner. This makes kinetic information easier to visualize, measure, report, and integrate with conventional static 18F-FET PET metrics and MRI findings.
This is clinically relevant because static TBR-based interpretation, although well established, is not entirely technique-independent and may be influenced by multiple factors. Moreover, overlap between recurrent tumor and treatment-related changes may occur, particularly in borderline lesions. Previous studies have documented TBRmax as the parameter with the highest performance for differentiating tumor recurrence from radiation induced changes. Bashir et al. (2019)8 showed 99% sensitivity of TBRmax (threshold of 2.0) for identifying recurrent glioblastoma in a post therapy setting. The present study demonstrates higher performance for DV in a dynamic 18F-FET PET study setting compared to TBRmax and TBRmean.
However, TBRs also showed high accuracy in the present study, although slightly lower than the DV. Since DV is a measurement of unbound tracer within a tissue, it reflects the vascularity and interstitial fluid volume within the tissue being measured. Studies comparing TBR from 18F-FET PET and cerebral blood volume estimation from contrast MRI have shown strong correlation between the two parameters within recurrent tumor reflecting higher rCBV within 18F-FET avid tumor cells. In a PET/MR study,11 mean TBRmax in recurrent tumor (3.97) was significantly elevated compared to radiation necrosis (mean TBRmax 1.21). As predicted NrCBV (cerebral blood volume normalized to contralateral white matter) in recurrence (mean 3.24) was also similarly elevated compared to radiation necrosis (mean NrCBV 1.51).
The use of LAFOV PET/CT systems such as Biograph Vision Quadra also facilitates accurate dynamic brain imaging. Simultaneous coverage of the brain and large vascular structures, such as the heart or the aorta, facilitates reliable extraction of an image derived arterial input function. Compared with carotid artery-based input functions on conventional axial field of view PET systems, this approach is less susceptible to partial-volume effects and image noise, potentially improving the accuracy and robustness of Patlak-derived kinetic parameters.
Furthermore, the Biograph Vision Quadra combines a 106 cm axial field of view with excellent time-of-flight performance and high system sensitivity, resulting in superior count statistics. This supports high-quality dynamic imaging, even for short acquisition frames or reduced administered activities, while also improving the quality of the static images reconstructed from the final 20 minutes of the dynamic acquisition, leading to more robust tumor-to-background ratio measurements.
Conclusion
Overall, direct Patlak-derived 18F-FET PET parametric imaging may serve as a practical intermediate step between simple static uptake assessment and comprehensive kinetic modelling. It enables dynamic PET information to be incorporated into routine image interpretation in a clinically intuitive manner and may improve diagnostic confidence in equivocal post-treatment glioma cases.
Examination protocol
Scanner: Biograph Vision Quadra